Instrumenting an LLM Application: Key Points
- The debugging unit in an LLM application is a decision, not an HTTP request.
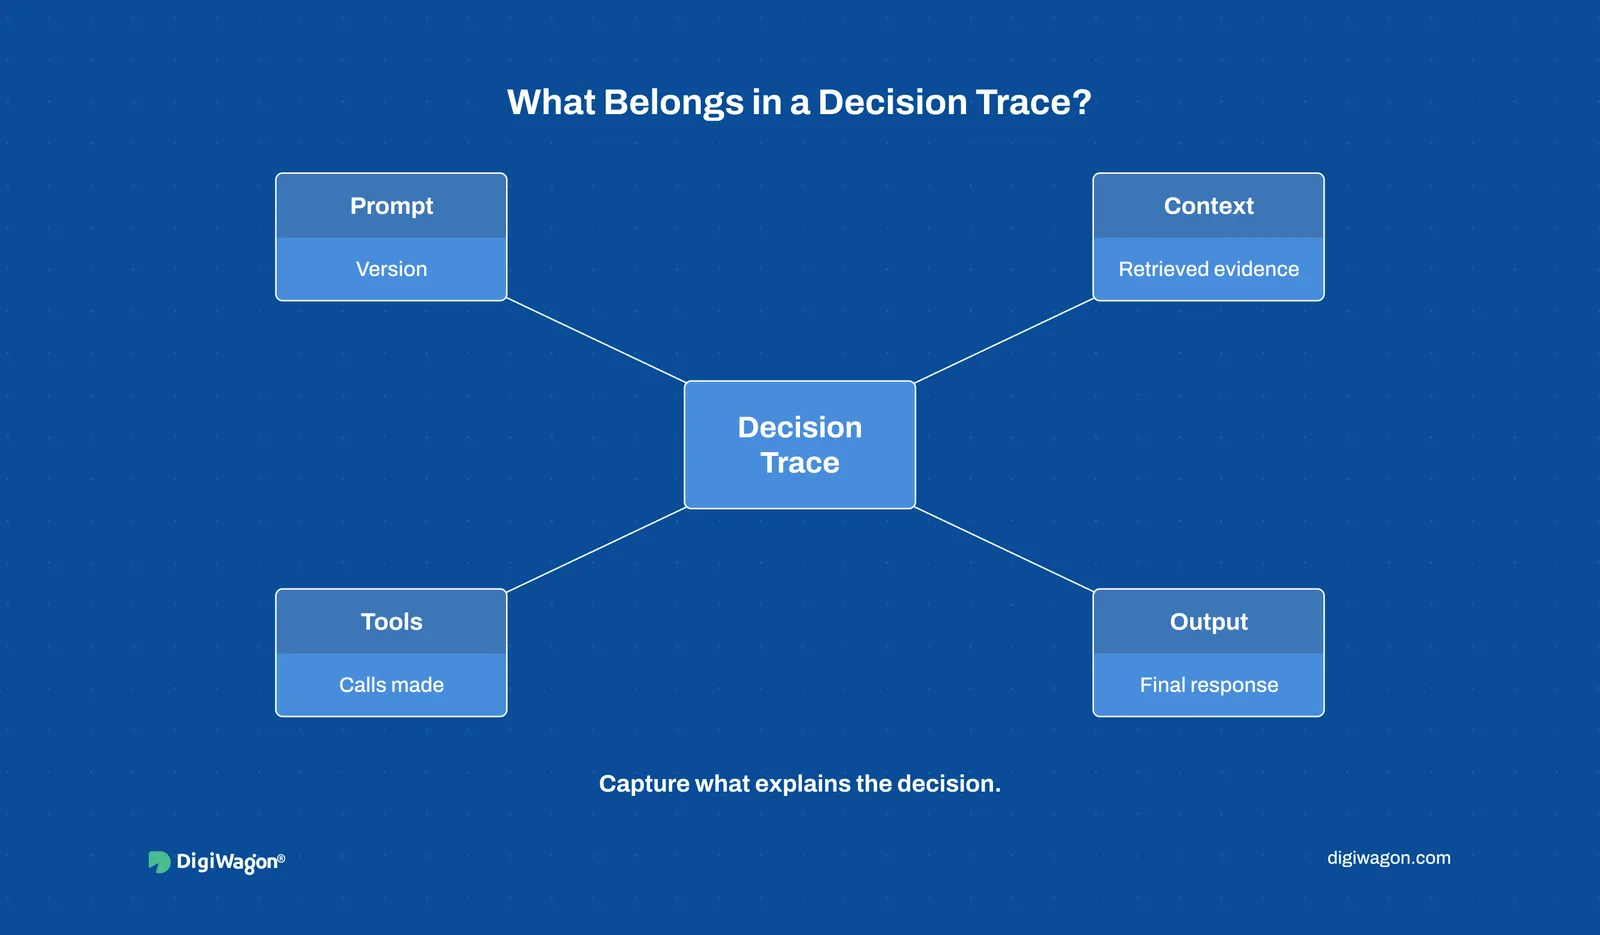
- A useful span holds the prompt version, retrieved context, tool calls and output together.
- OpenTelemetry's GenAI conventions keep message content capture opt-in, deliberately.
- Sampling strategy is an architectural choice set by the latency budget, not a config toggle.
- Evaluation and production telemetry belong in separate stores, or regressions stay invisible.
- Reconstructing a past decision needs the retrieved evidence stored, not the model output alone.
What Is LLM Observability?
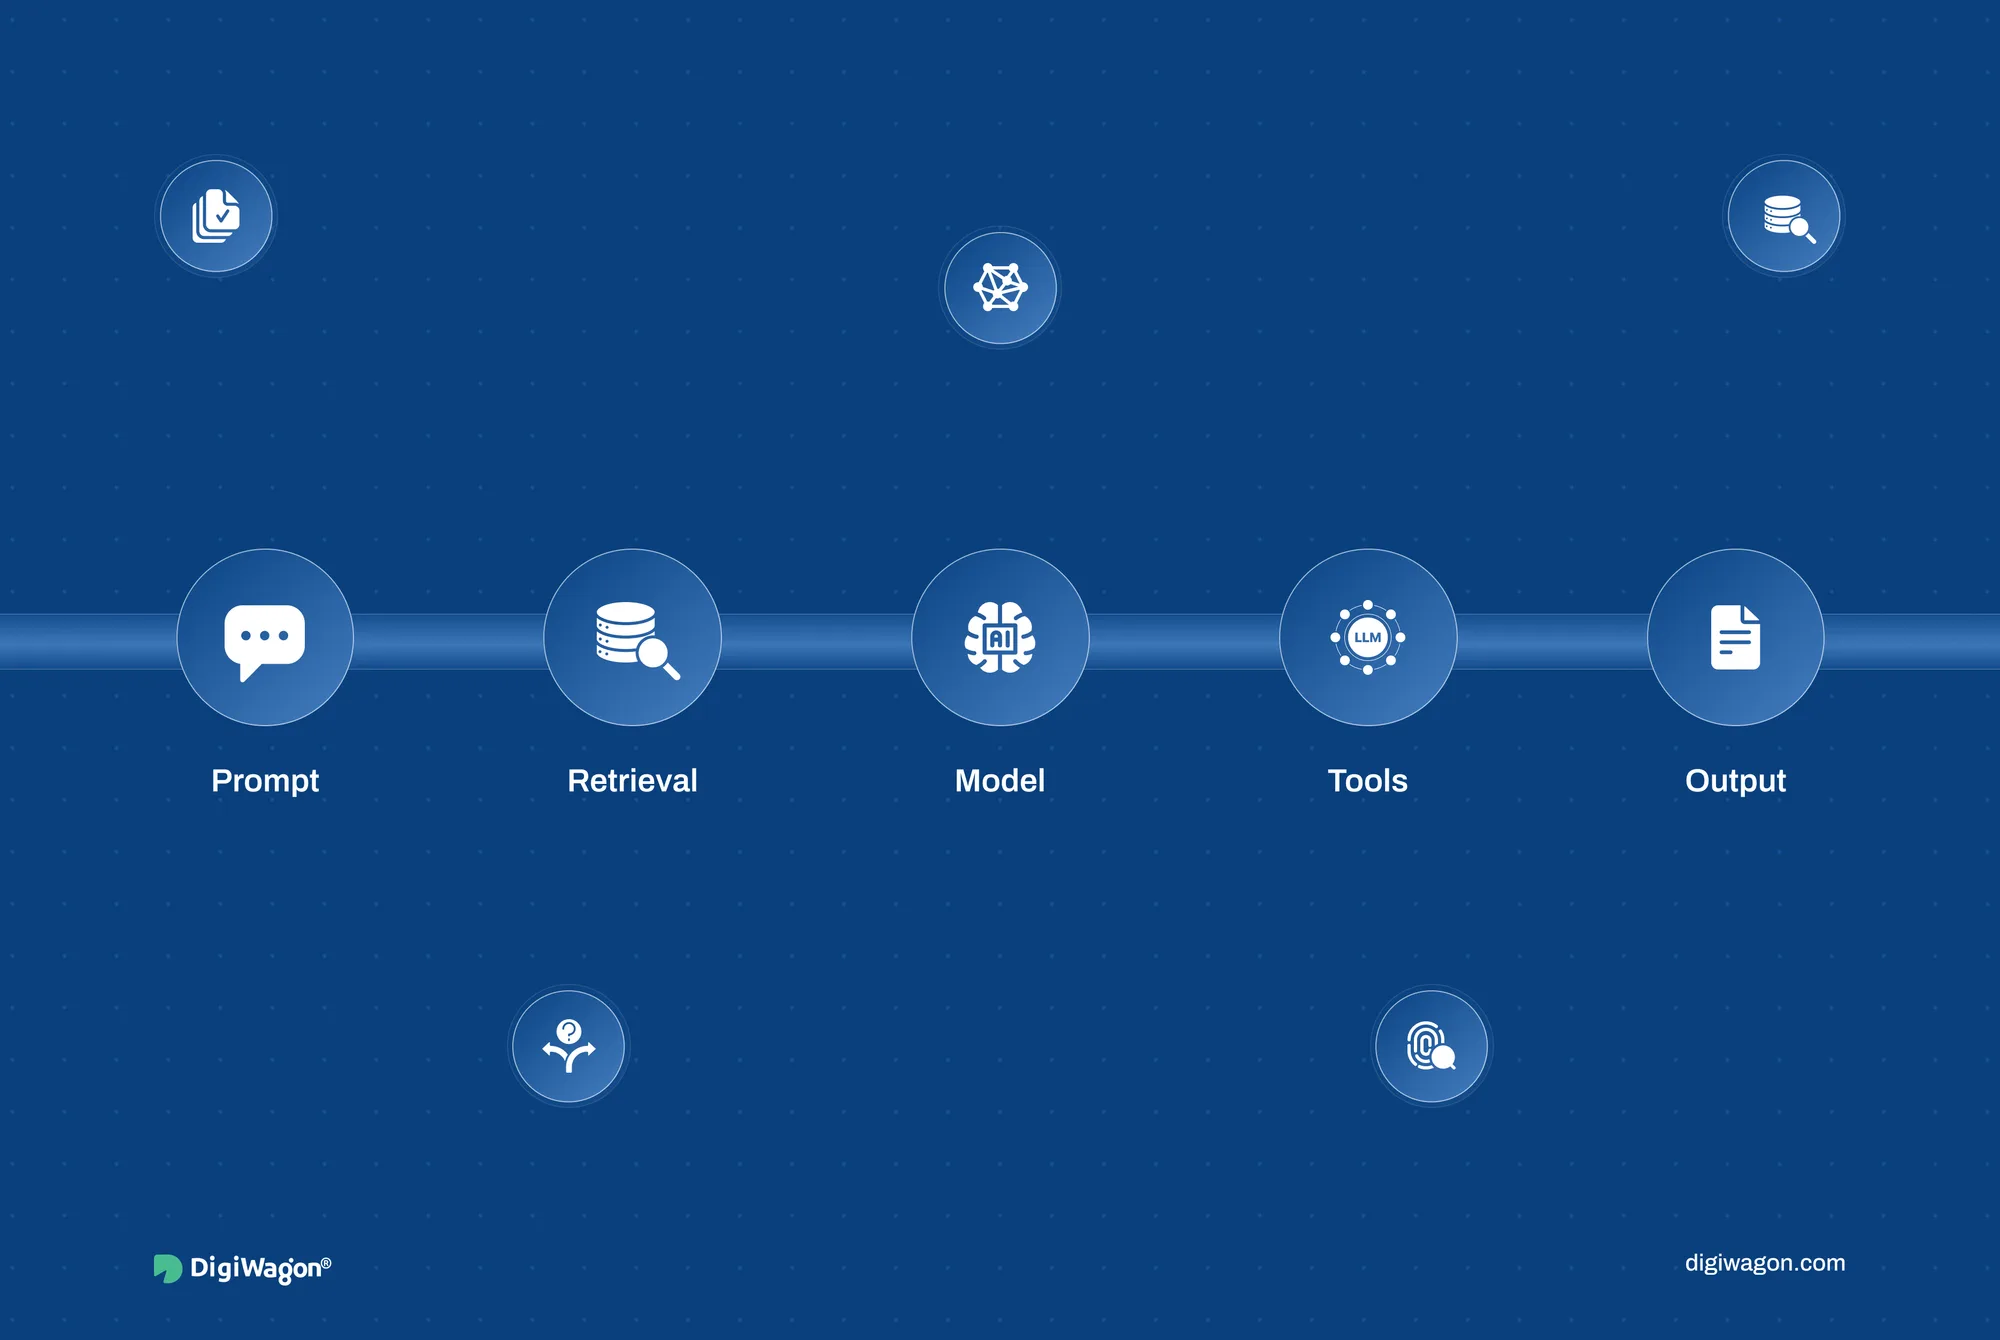
LLM observability is the instrumentation of a generative AI application so any past model decision can be reconstructed from stored telemetry. It links the prompt version, the retrieved context, the tool calls and the output inside a single trace. That trace, not the completion text, is what a debugger reads.
The Debugging Gap in Production LLM Systems
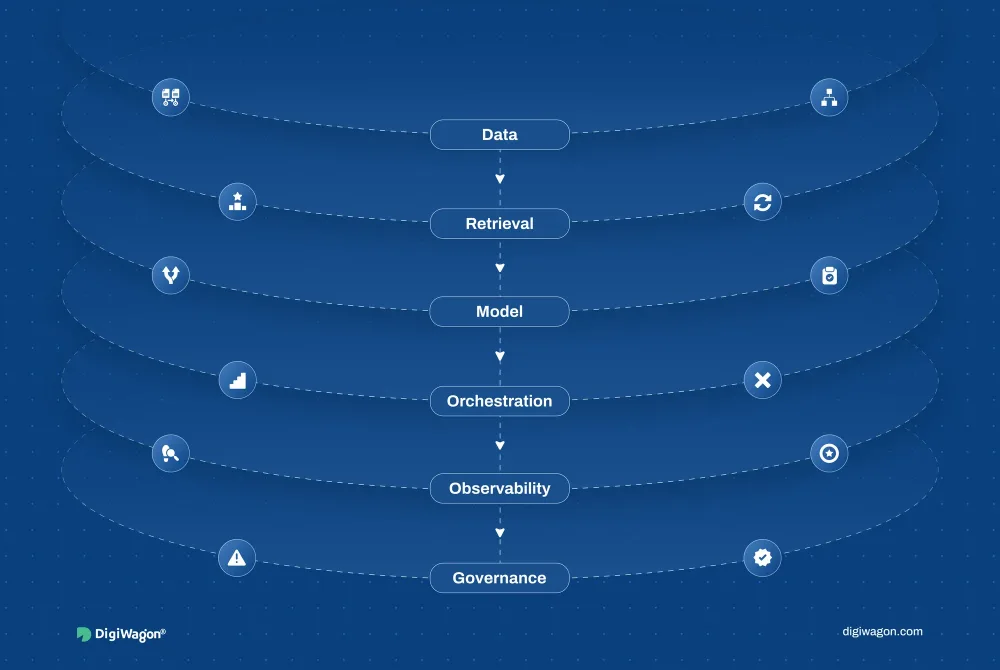
Application monitoring answers two questions: what is broken, and why. The four golden signals in Google's SRE Book, latency, traffic, errors and saturation, answer the first well and the second only when the cause sits in the system's own state. The enterprise AI architecture blueprint treats telemetry as a platform layer, and this is that layer.
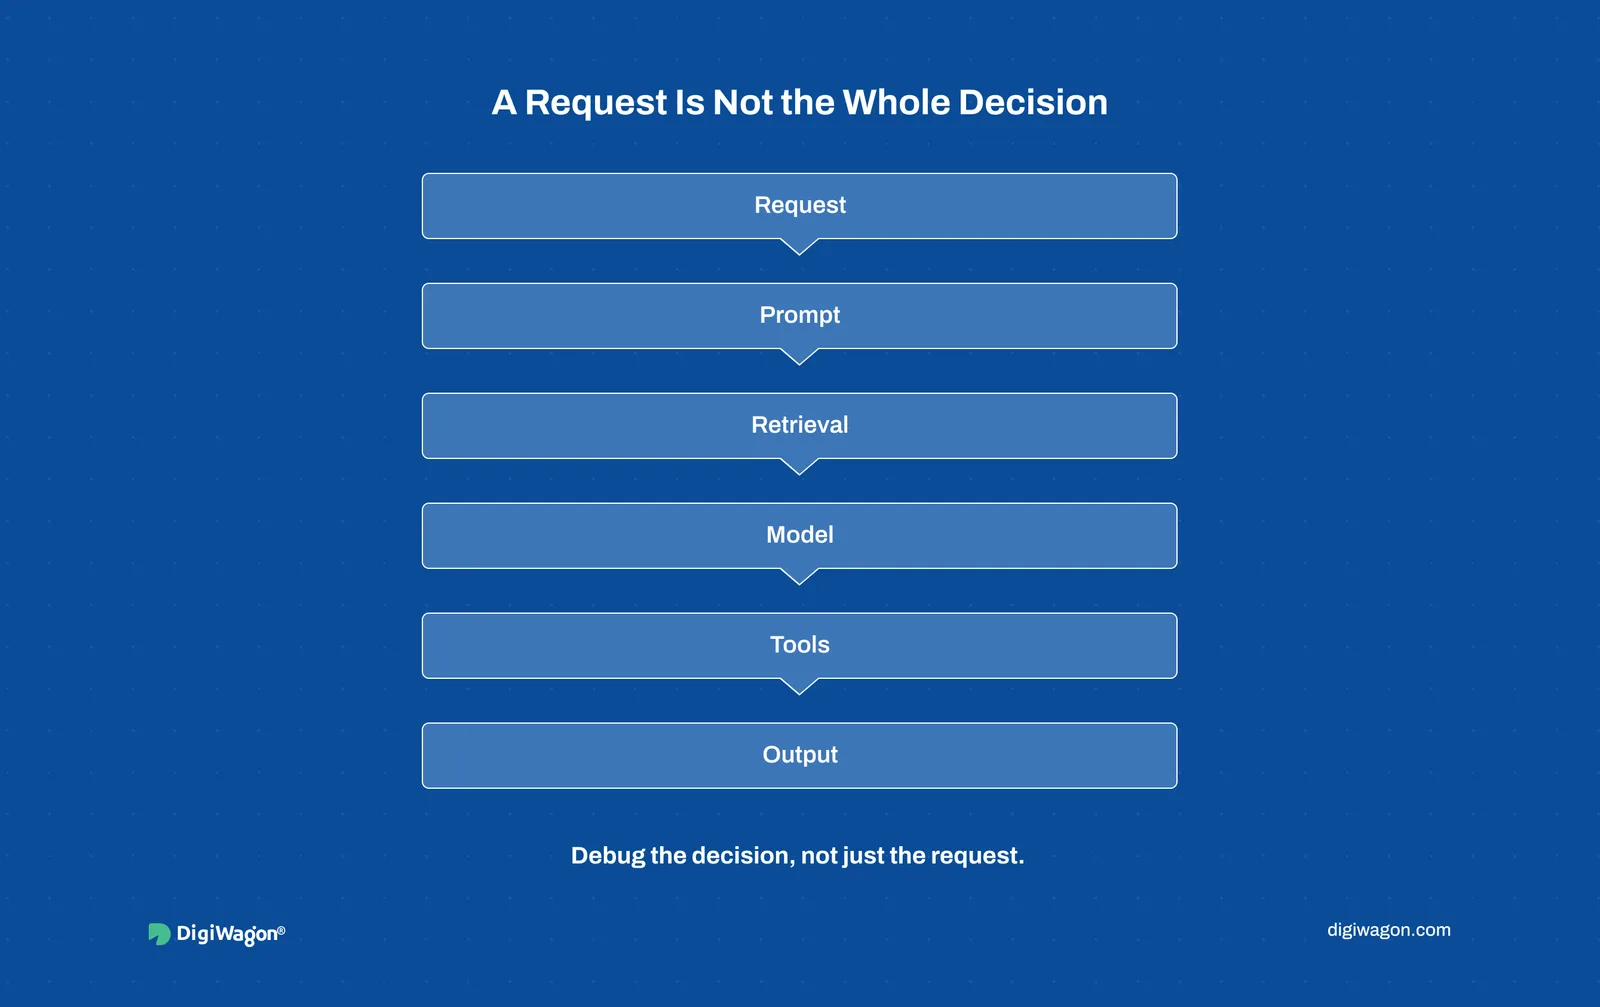
An LLM call breaks the second question. The request succeeded, the status code was 200, latency sat inside budget, and the answer was still wrong. The cause lives in the prompt, the retrieved context or the model version, and a request-level span records none of them.
Gartner expects more than 40% of agentic AI projects to be cancelled by the end of 2027, citing escalating costs and inadequate risk controls (Gartner, 2025). A team that cannot explain one production decision cannot argue either case.
Why Doesn't Request-Level Telemetry Explain an LLM Outcome?
Because the request is the wrong boundary. One user question fans out into retrieval, reranking, one or more inference calls, tool execution and post-processing. A span carrying model name, token counts and duration tells you the whole thing was slow, not which layer was wrong.
The OpenTelemetry GenAI semantic conventions already model this as distinct span types: inference, embeddings, retrieval, memory and tool execution (OpenTelemetry, Development status, 2026). A retrieval span is named {gen_ai.operation.name} {gen_ai.data_source.id}; a tool span is named execute_tool {gen_ai.tool.name}. The shape of the standard is the argument: a decision is a tree of operations, so the trace has to be a tree.
The attributes that carry the decision
- gen_ai.operation.name and gen_ai.provider.name are required on an inference span
- gen_ai.request.model, gen_ai.conversation.id and gen_ai.output.type carry the call context
- gen_ai.prompt.name and gen_ai.prompt.version are conditionally required when a named prompt template is used
Prompt version as a first-class span attribute separates "we changed the prompt" from "the provider changed the model underneath us". Without it, both regressions look identical and the postmortem becomes an argument rather than a query.
What Belongs Inside a Decision-Level Span?
Most designs miss in one of two directions: too little and the trace explains nothing, too much and a sensitive data set now lives in an observability platform.
The conventions are direct about it. Instrumentations SHOULD NOT capture model instructions, input messages or output messages by default, and SHOULD provide an opt-in (OpenTelemetry, 2026). The three usage patterns the spec names are three different architectures.
| Capture strategy | What the span carries | Telemetry volume | Access model | Where it fits |
|---|---|---|---|---|
| No content capture (spec default) | Metadata, token counts, prompt version, timings | Lowest | Same as ops telemetry | Nothing needs reconstructing later |
| Content on span attributes | gen_ai.input.messages and gen_ai.output.messages inline | Highest, often past envelope limits | Trace readers read user content | Pre-production and evaluation |
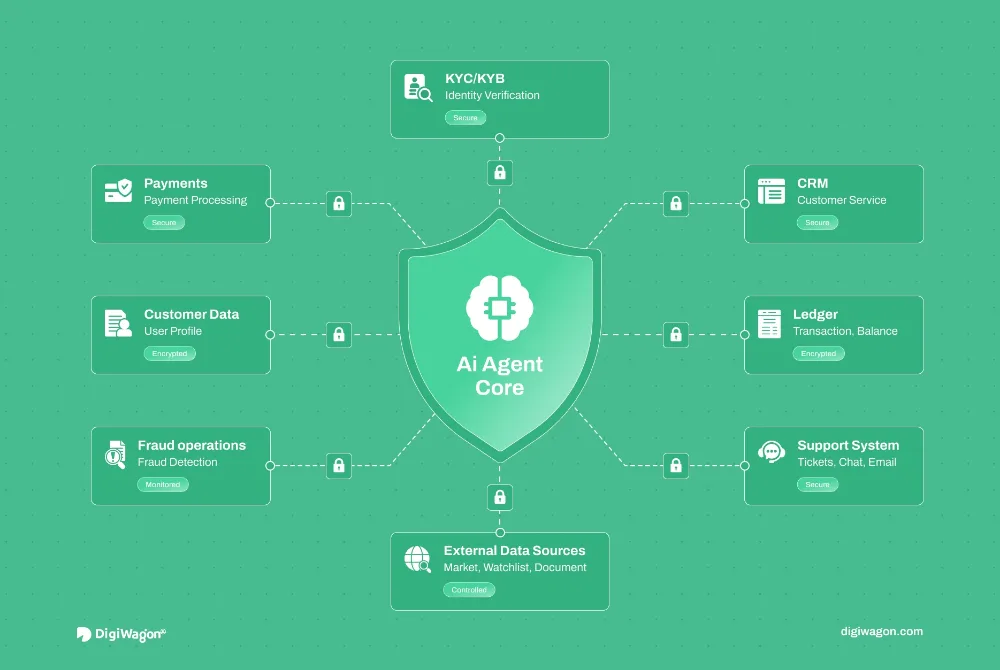
| External store plus span reference | Reference identifiers, payloads in object storage | Low on the hot path | Separate controls on the store | Production with sensitive inputs |
The third row is what production needs and what instrumentation defaults rarely give you. When the platform has to reconstruct decisions, the architectural pattern is an upload hook on the instrumentation path plus a content store with its own access boundary: the span holds pointers, the payloads sit under separate controls.
One line in the spec is worth copying into your design. The upload hook SHOULD run regardless of the sampling decision, because the sampled-out trace is exactly the one someone will ask you to explain.
How Do You Keep LLM Observability Inside a Latency Budget?
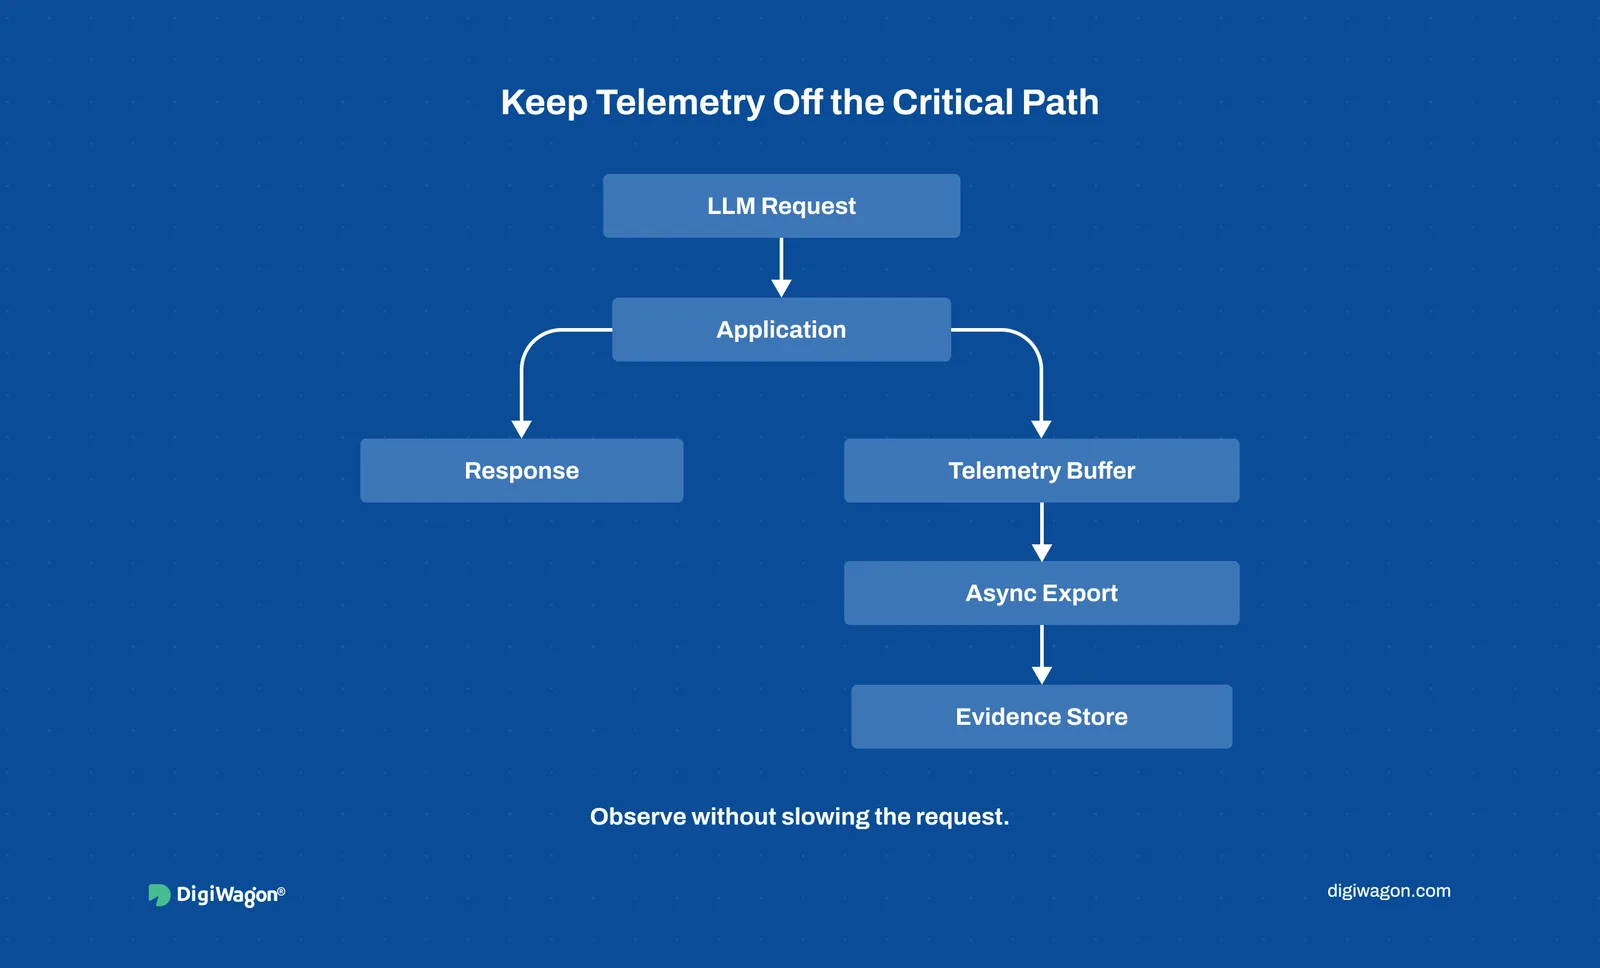
Synchronous capture on the request path is the failure mode. Serialising a prompt plus retrieved context costs time proportional to context size, which grows as the application gets better.
Three levers, in the order they pay off:
- Asynchronous export and batching. The request path writes to a buffer, not to a backend.
- Payload upload off the request path. The hook handles content; the span carries the reference.
- Trace-level sampling with deterministic retention. Keep every error, every decision past a risk threshold, and a slice of ordinary traffic for a baseline.
When a screening path has a hard latency budget, the architectural response is head sampling at the trace root with explicit retention rules, not a lower log level. Head sampling decides once, cheaply, before the work happens; tail sampling decides after seeing the whole trace and pays for it in collector memory.
Teams designing this layer against a delivery date can see how LLM engineering services cover instrumentation through production rollout.
Separating Evaluation Telemetry from Production Telemetry
NIST's AI Risk Management Framework 1.0 gives measurement its own core function, MEASURE, alongside Govern, Map and Manage (NIST, 2023). Measurement is a platform requirement with its own storage, not a dashboard opened after launch.
Eval runs and production traffic have incompatible shapes. An eval run is batch, repeatable and pinned to a dataset and prompt version. A production trace is streaming, sampled and pinned to a session. In one store, aggregate metrics move for reasons no query can separate.
One span schema, two destinations. Same attribute names, distinct resource attributes, separate stores, so the two stay diffable while a nightly sweep never moves the production baseline. That split belongs in the observability layer of the production AI architecture patterns, not the reporting tool above it.
What Changes When a Regulator Asks Why a Decision Was Made?
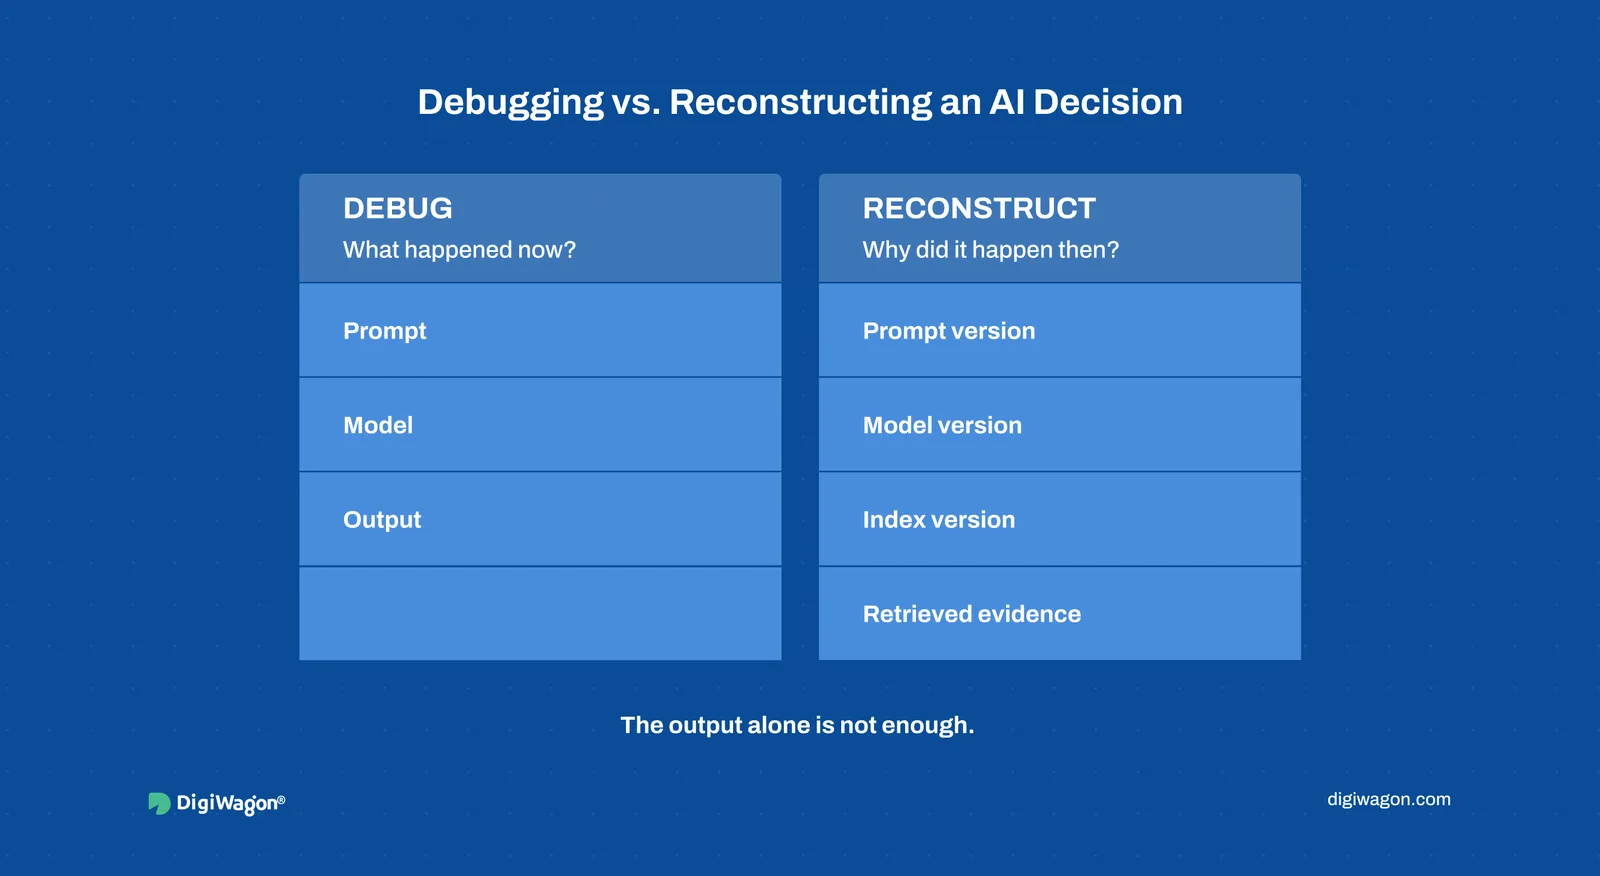
Debugging asks why the system produced this output now. Reconstruction asks why it produced that output months ago, from stored evidence, with the retrieval corpus already changed underneath.
When a platform has to answer for a past decision, the architectural response is to version everything that fed it and store the evidence at decision time: prompt template version, model identifier, retrieval index version, and the identifiers of the documents returned. A completion string proves what the model said, not what it was looking at.
In RegTech platform engineering the retrieval corpus is a watchlist that changes daily, so an index version on the span separates a reconstructable decision from a guess. The same discipline runs through designing auditable AI systems.
Lessons from Instrumenting an LLM Alert-Triage Pipeline
We built the LLM alert-triage layer inside RapidAML's AI-powered AML screening platform: the model proposes a disposition on a screening alert, an analyst confirms it. The question afterwards was never "what did the model say", it was "why was this alert closed". That means the retrieved evidence, not the completion.
Three calls held up:
- We logged the full prompt and retrieval context per decision, not input and output alone. The completion answers no reconstruction request by itself.
- We chose trace-level sampling over full synchronous capture, because the screening path could not absorb serialising retrieved context inside a sub-200ms budget. Payload upload moved to an asynchronous hook.
- We chose structured decision records in PostgreSQL with JSONB evidence columns over free-text traces in the log store, because the trail had to be queryable by alert identifier and list version. Instrumentation was the OpenTelemetry Python SDK; payloads went to object storage behind its own boundary.
Separating evaluation telemetry from production came last and should have come first. Until it did, every prompt change looked like a model regression.
Instrumenting Your LLM Stack with DigiWagon
DigiWagon builds the telemetry layer for production LLM systems, from span schema to the evidence store behind reconstruction.
- Span schema aligned to OpenTelemetry's GenAI conventions
- Prompt and retrieval capture behind a content-store boundary
- Sampling and export design against a latency budget
- Evaluation telemetry kept out of the production baseline
Designing the Trace Before the Dashboard
LLM observability comes down to one boundary: is the trace built around the request or the decision? Choose the request and you get healthy dashboards over a system returning wrong answers. Choose the decision and the prompt version, retrieved evidence, tool calls and output arrive together, which is the only shape that answers "why did it do that". Sampling strategy and the evaluation split follow from that call. Systems instrumented at the decision boundary stay debuggable by the team that built them and reconstructable by the team that inherits them.