Embedded Analytics: What Matters Most
- Embedded analytics is the better architecture when analytics needs to be delivered directly inside a SaaS product for customers or end users.
- Standalone BI is the better fit when analytics is primarily consumed by internal data teams that need deeper ad-hoc exploration and cross-system analysis.
- The decision affects more than reporting. It shapes multi-tenancy, user experience, pricing model, and product retention.
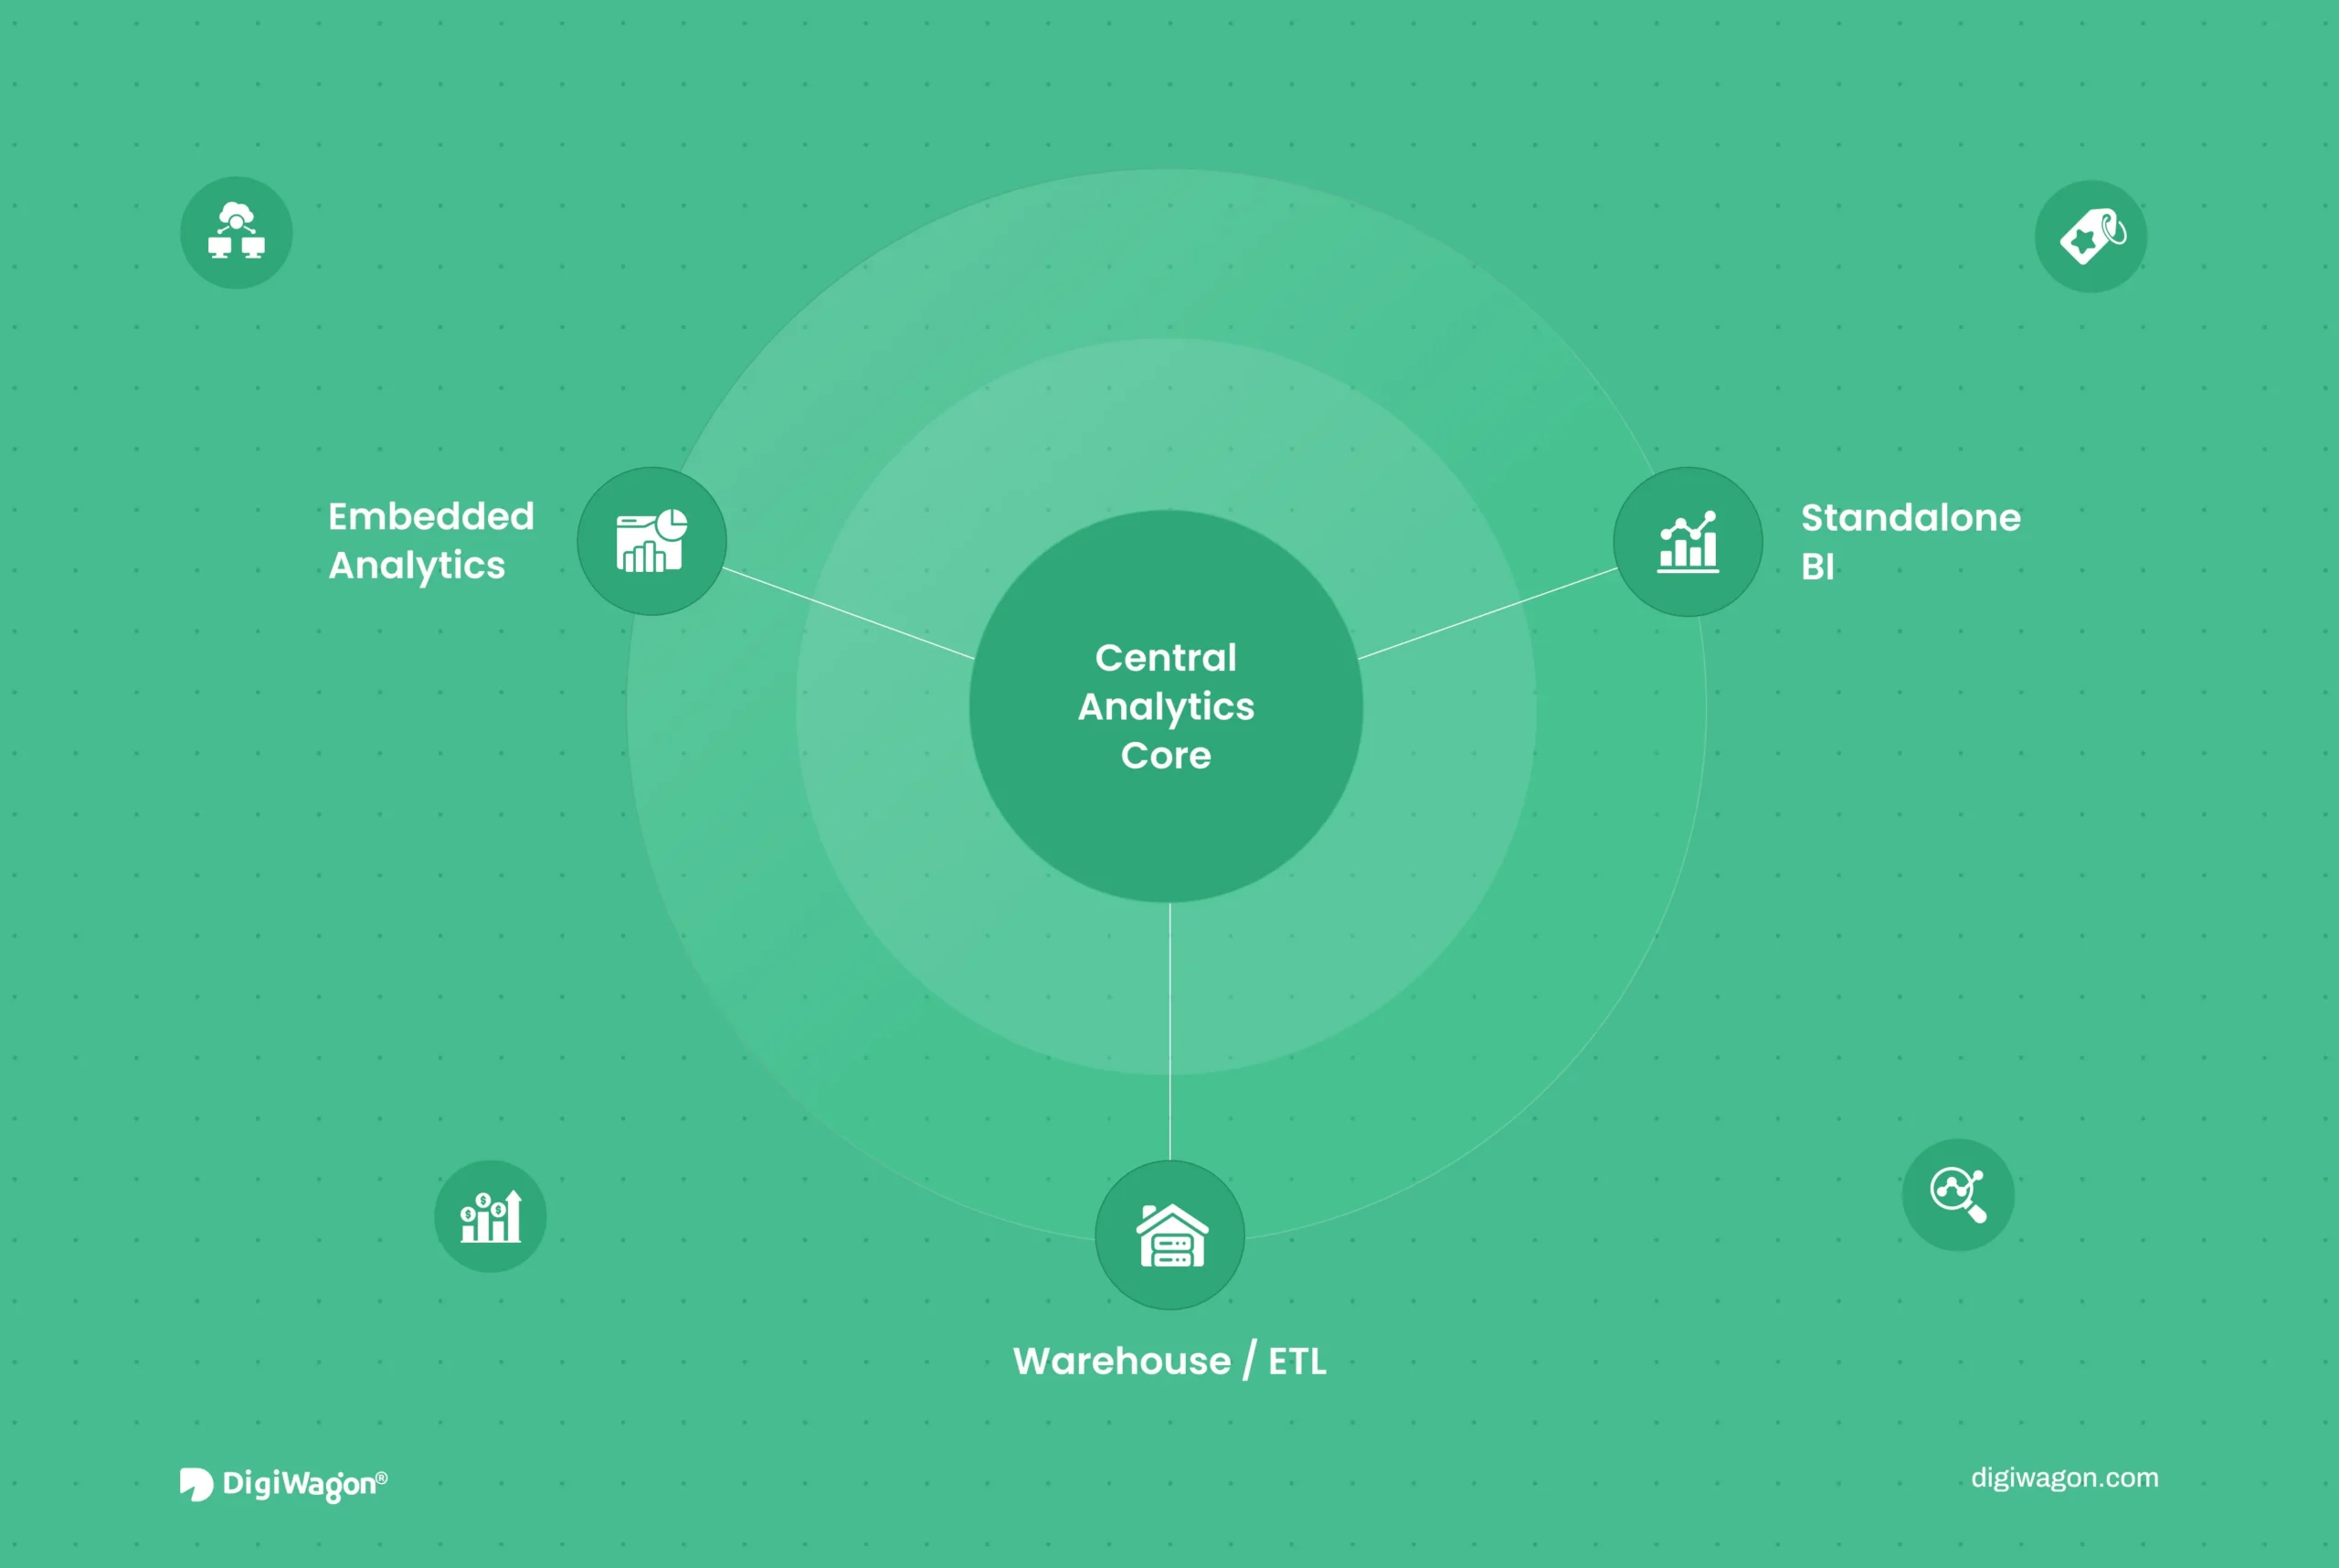
- Many mature SaaS products end up using a hybrid architecture: embedded dashboards for customers, standalone BI for internal teams, and a shared warehouse underneath both.
- The right choice depends on who needs the analytics, how data must be isolated, and whether analytics is becoming part of the product itself.
What Are Embedded Analytics and Standalone BI?
Embedded analytics is the integration of dashboards, reports, and data visualisations directly inside a software application, so users access insights without leaving the product.
Standalone BI is a separate analytics platform like Tableau, Power BI, or Looker – that users log into independently to query data and build reports. Unlike standalone tools designed for analysts, embedded analytics targets the end user: the loan officer, the warehouse manager, the account executive who needs data but will never write SQL.
The short version of BI vs embedded analytics: standalone BI is a tool your own analysts open to explore data across systems; embedded analytics is a feature your customers use inside your product without knowing a BI tool is involved. The first optimises for breadth and ad-hoc questions, the second for tenancy, branding and a native feel. The rest of this article is about which of those your reporting actually needs.
Why This Decision Matters for SaaS Product Teams Now
For SaaS teams, the embedded analytics versus standalone BI decision is not just about reporting. It affects how users access insights, how tenant data is separated, and how analytics creates value inside the product.
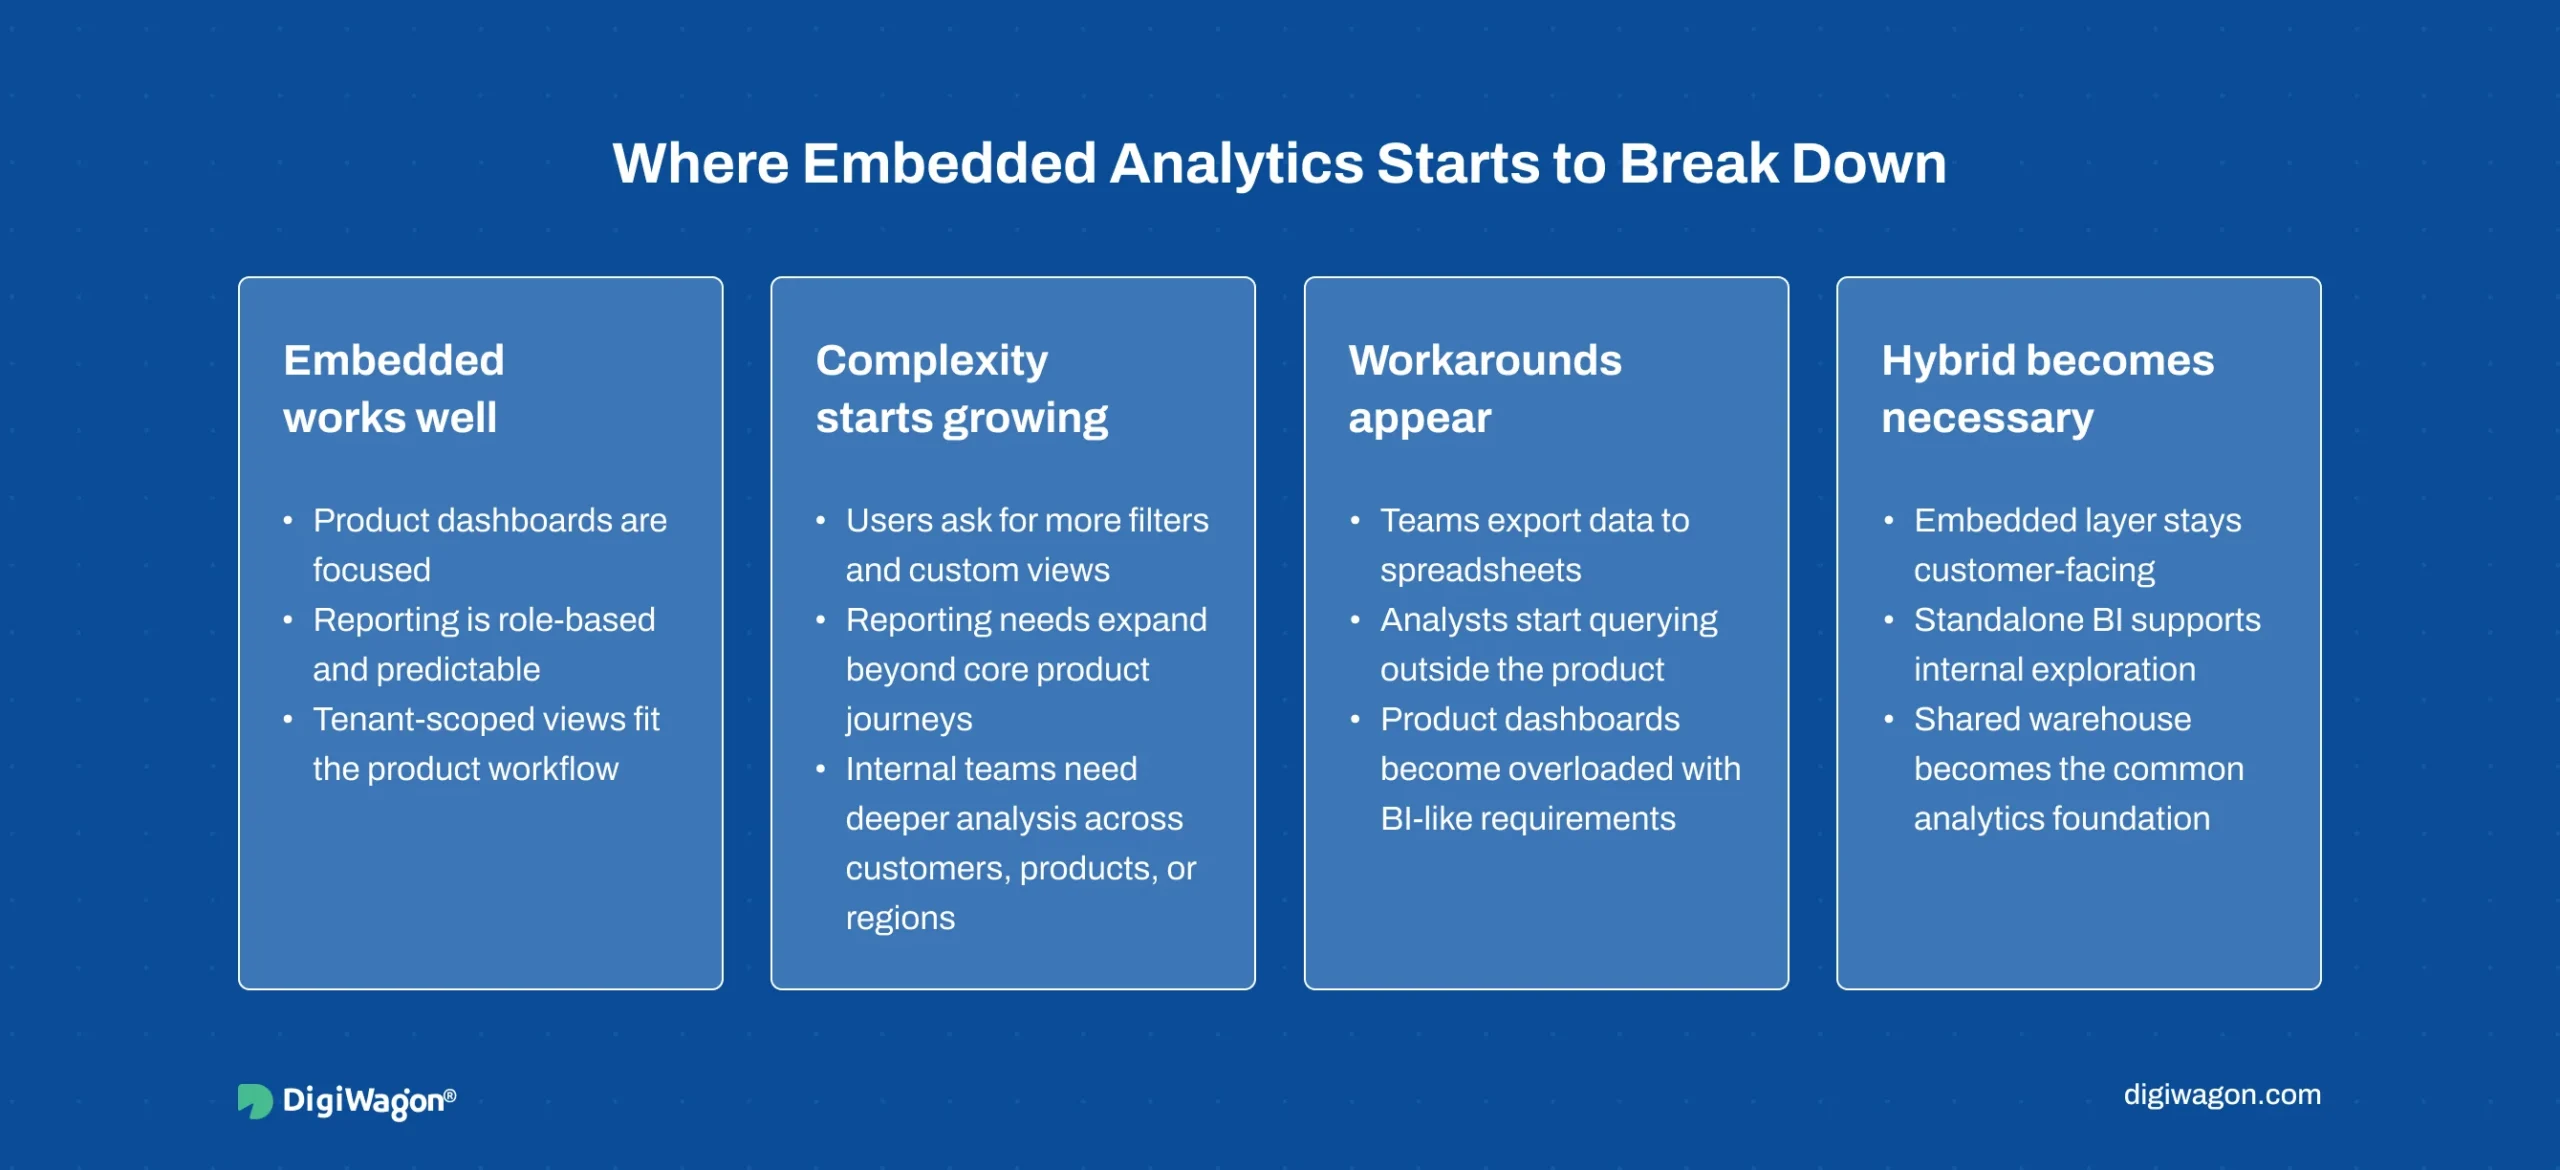
Embedded analytics is usually the better fit when reporting is part of the user experience. Standalone BI is more useful when internal teams need deeper cross-system analysis. The challenge is that many products need both, but not in the same way.
That is why the decision should be made as an architecture choice, not a tool choice.
What Makes Embedded Analytics Different from Standalone BI in Practice?
The architectural implications run deeper than “dashboards inside vs. outside.”
Multi-Tenancy and Data Isolation
This is where most standalone BI evaluations fall apart for SaaS.
Traditional BI tools assume a single organisation with a single identity model. Multi-tenant architectures require complex workarounds: separate database schemas per client, manual row-level security configuration, or multiple separate BI instances. None of this scale economically.
Embedded analytics platforms: Metabase (Pro/Enterprise), Apache Superset, Qrvey, Embeddable, DataBrain were built with multi-tenancy as a first-class concept. Row-level security, tenant isolation, and permission models are core features you configure once, not once per customer.
Branding and User Experience
If you are a SaaS company delivering analytics to your customers, you cannot put a Tableau or Power BI logo inside your product. Embedded platforms let you style dashboards to match your design system. To the end user, the analytics are part of your product, not a separate tool.
Pricing Model
Standalone BI pricing is per-seat. Tableau Creator runs $75/user/month. Power BI Pro is $10/user/month but jumps to $20+ for Premium Per User. When your SaaS product has 5,000 end users who occasionally view a dashboard, per-seat licensing collapses the economics.
Embedded platforms price by tenant, compute capacity, or flat subscription – models designed for SaaS distribution where user count scales independently of analytics cost.
Ad-Hoc Query Flexibility
This is where standalone BI still wins. Tableau, Power BI, and Looker give trained analysts the ability to explore data freely – custom queries, calculated fields, cross-dataset joins. Most embedded platforms constrain users to pre-built dashboards. If your primary analytics users are analysts who think in SQL, embedded will feel limiting.
| Criterion | Embedded Analytics | Standalone BI |
|---|---|---|
| Primary audience | End users, customers, non-technical operators | Internal analysts, data teams, executives |
| Multi-tenancy | Native (row-level security, tenant isolation) | Requires workarounds (separate schemas, manual RLS) |
| Branding | Full white-label, matches product UI | Vendor branding visible; limited customisation |
| Pricing model | Per-tenant, per-capacity, or flat subscription | Per-seat (scales with user count) |
| Ad-hoc query power | Constrained to pre-built or guided exploration | Full SQL, calculated fields, cross-source joins |
| User adoption | 2-3x higher (no context switching) | ~30% adoption rate across organisations |
| Best for | Customer-facing SaaS analytics | Internal BI, executive reporting, exploratory analysis |
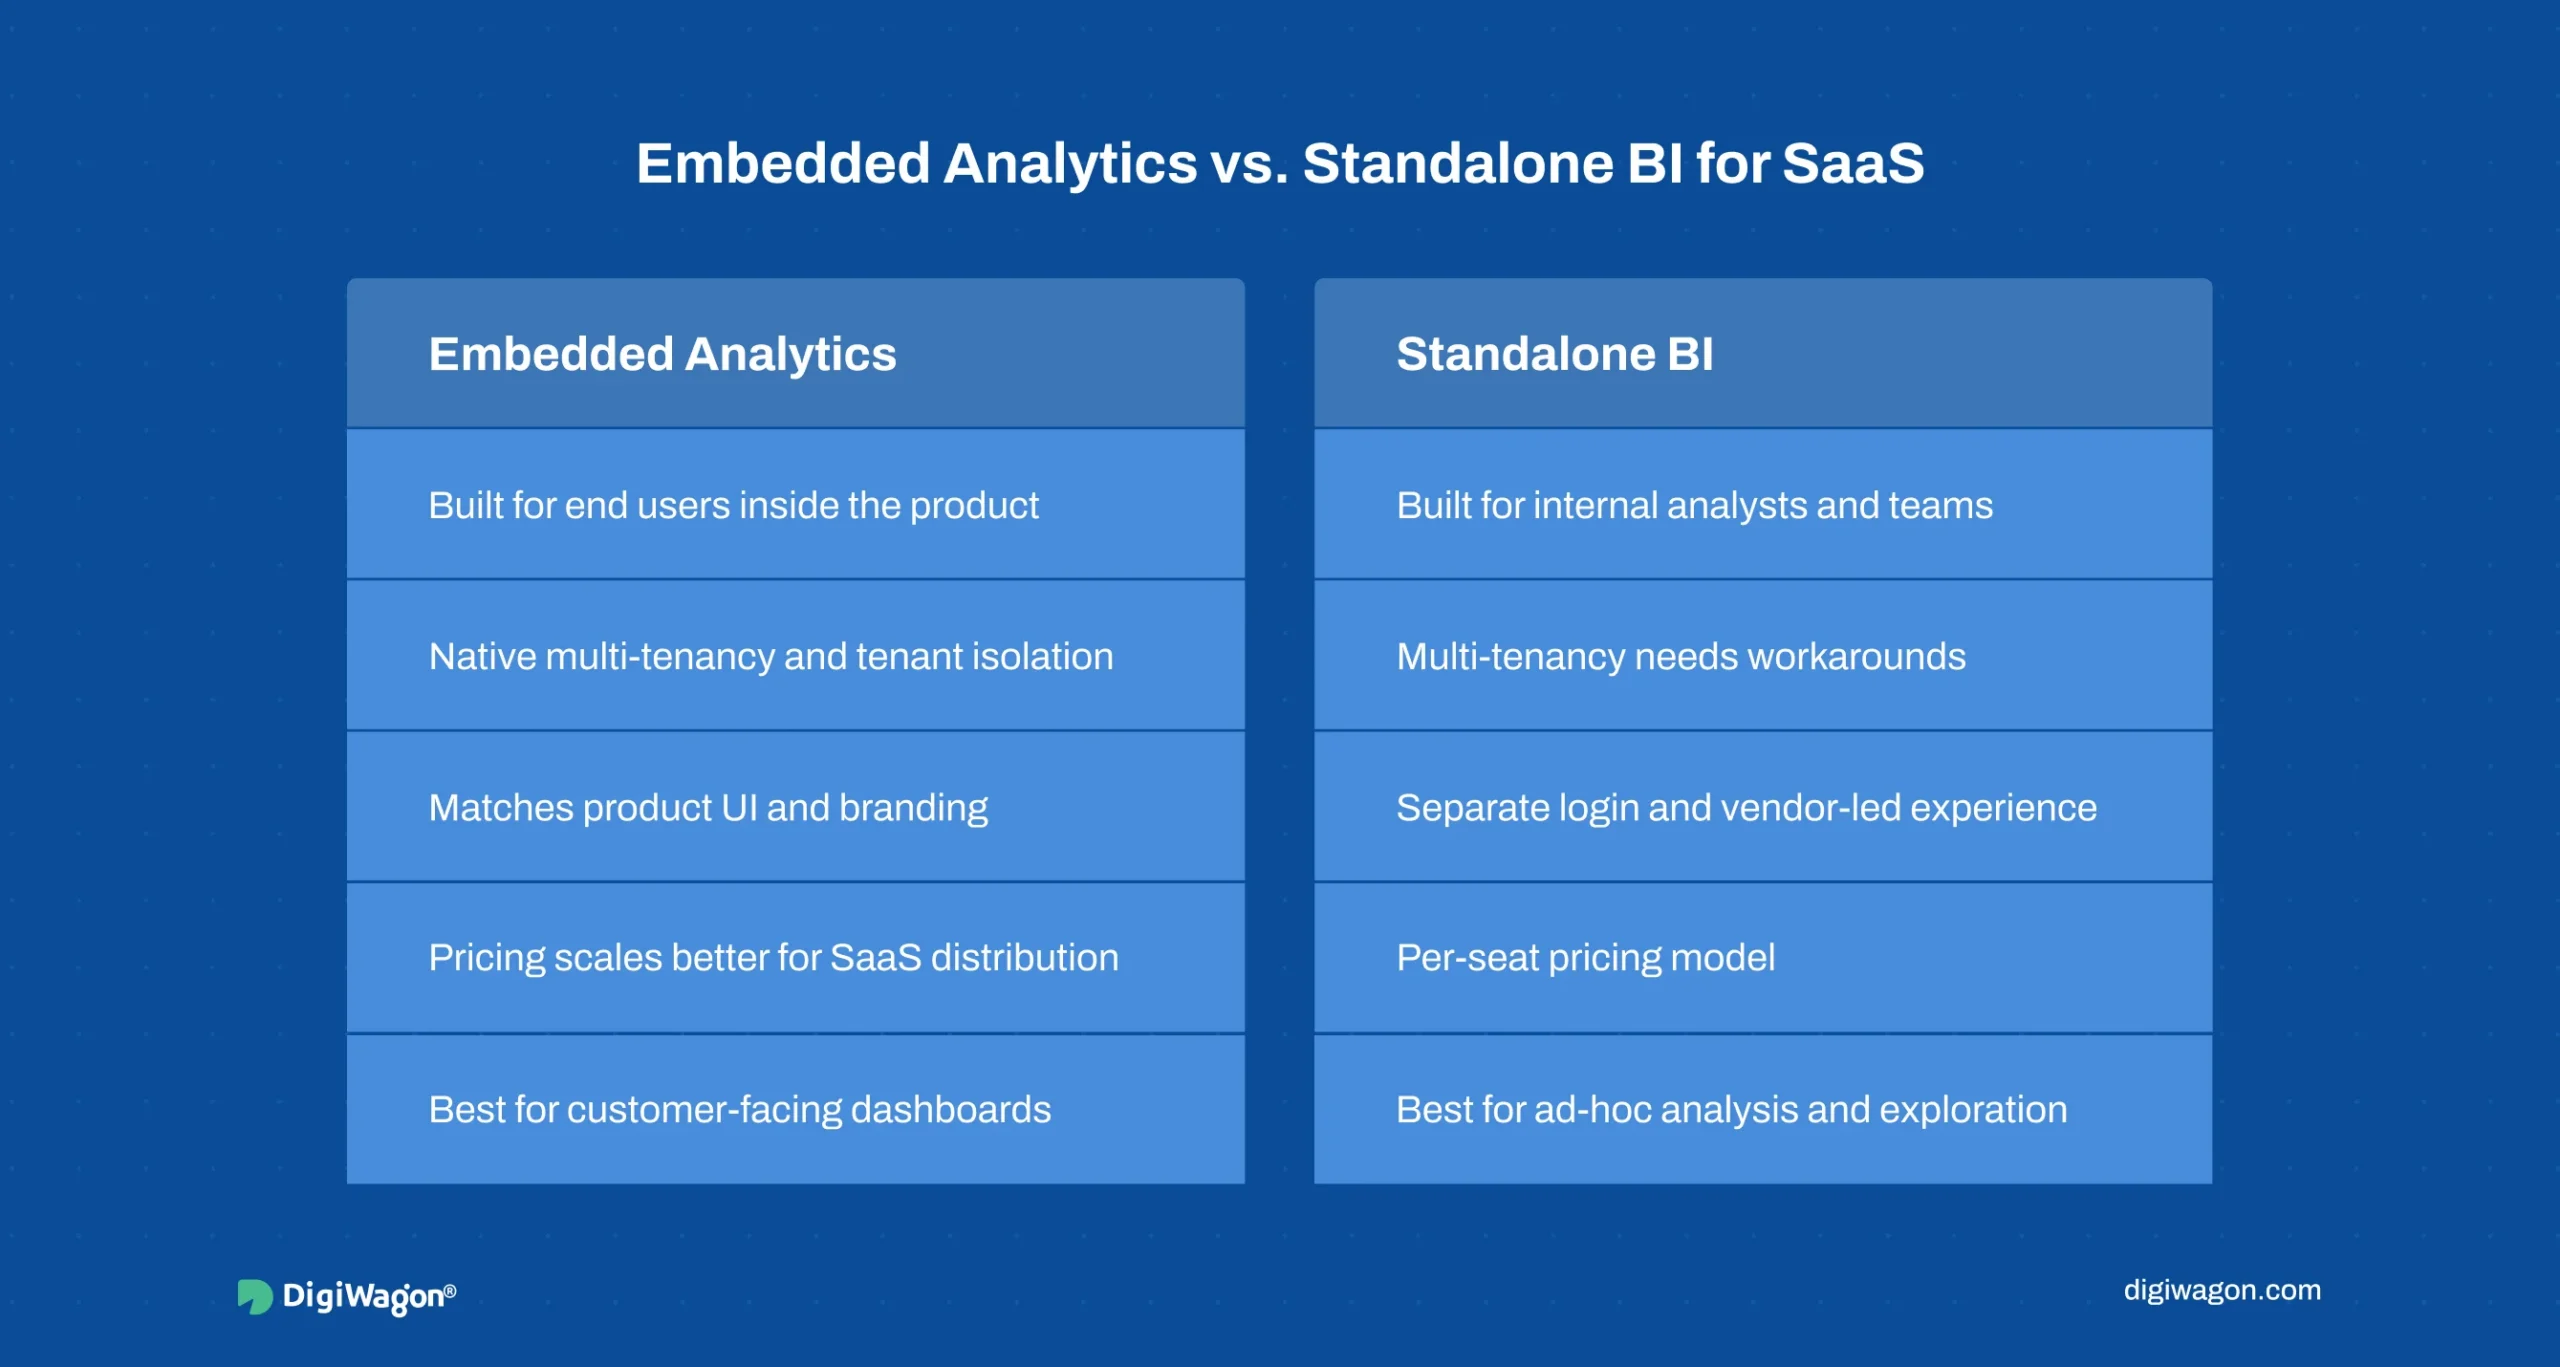
Most SaaS products do not need a full standalone BI experience for end users. They need analytics that feels native inside the product first, with deeper BI capabilities reserved for internal teams or advanced use cases.
When Should You Choose Embedded Analytics?
Your Customers Need to See Their Own Data Inside Your Product
If you are building a lending platform, loan officers need disbursement rate dashboards where they process applications not in a separate Tableau login. If you are building workforce management software, production managers need shift coverage dashboards where they schedule shifts. When the analytics consumer is your customer’s employee, embedded is the right architecture.
Analytics Is Part of Your Pricing or Differentiation Strategy
Many SaaS companies monetise analytics as a premium tier. Base plan: basic metrics. Growth plan: custom dashboards. Enterprise plan: white-label analytics portal.
When customers build workflows around dashboards inside your product, switching costs go up. The analytics layer becomes part of how they run their business. That is a retention lever standalone BI cannot deliver.
You Need Multi-Tenant Isolation Without Engineering Workarounds
If you have 50+ customer accounts, each requiring strict data isolation, embedded platforms that handle multi-tenancy natively save months of engineering time compared to configuring row-level security per customer in Tableau or Power BI.
When Should You Stick with Standalone BI?
Standalone BI is the better fit when your analytics users are internal data analysts who need full exploration tools (Tableau’s visual query builder, Power BI’s DAX, Looker’s LookML), when you need complex cross-system joins that embedded platforms cannot handle, or when your product does not have customer-facing reporting requirements at all. For internal tooling, developer infrastructure, and B2B API products where end users never expect a dashboard, standalone BI internally plus no embedded layer is the right call.
What Does a Hybrid Architecture Look Like?
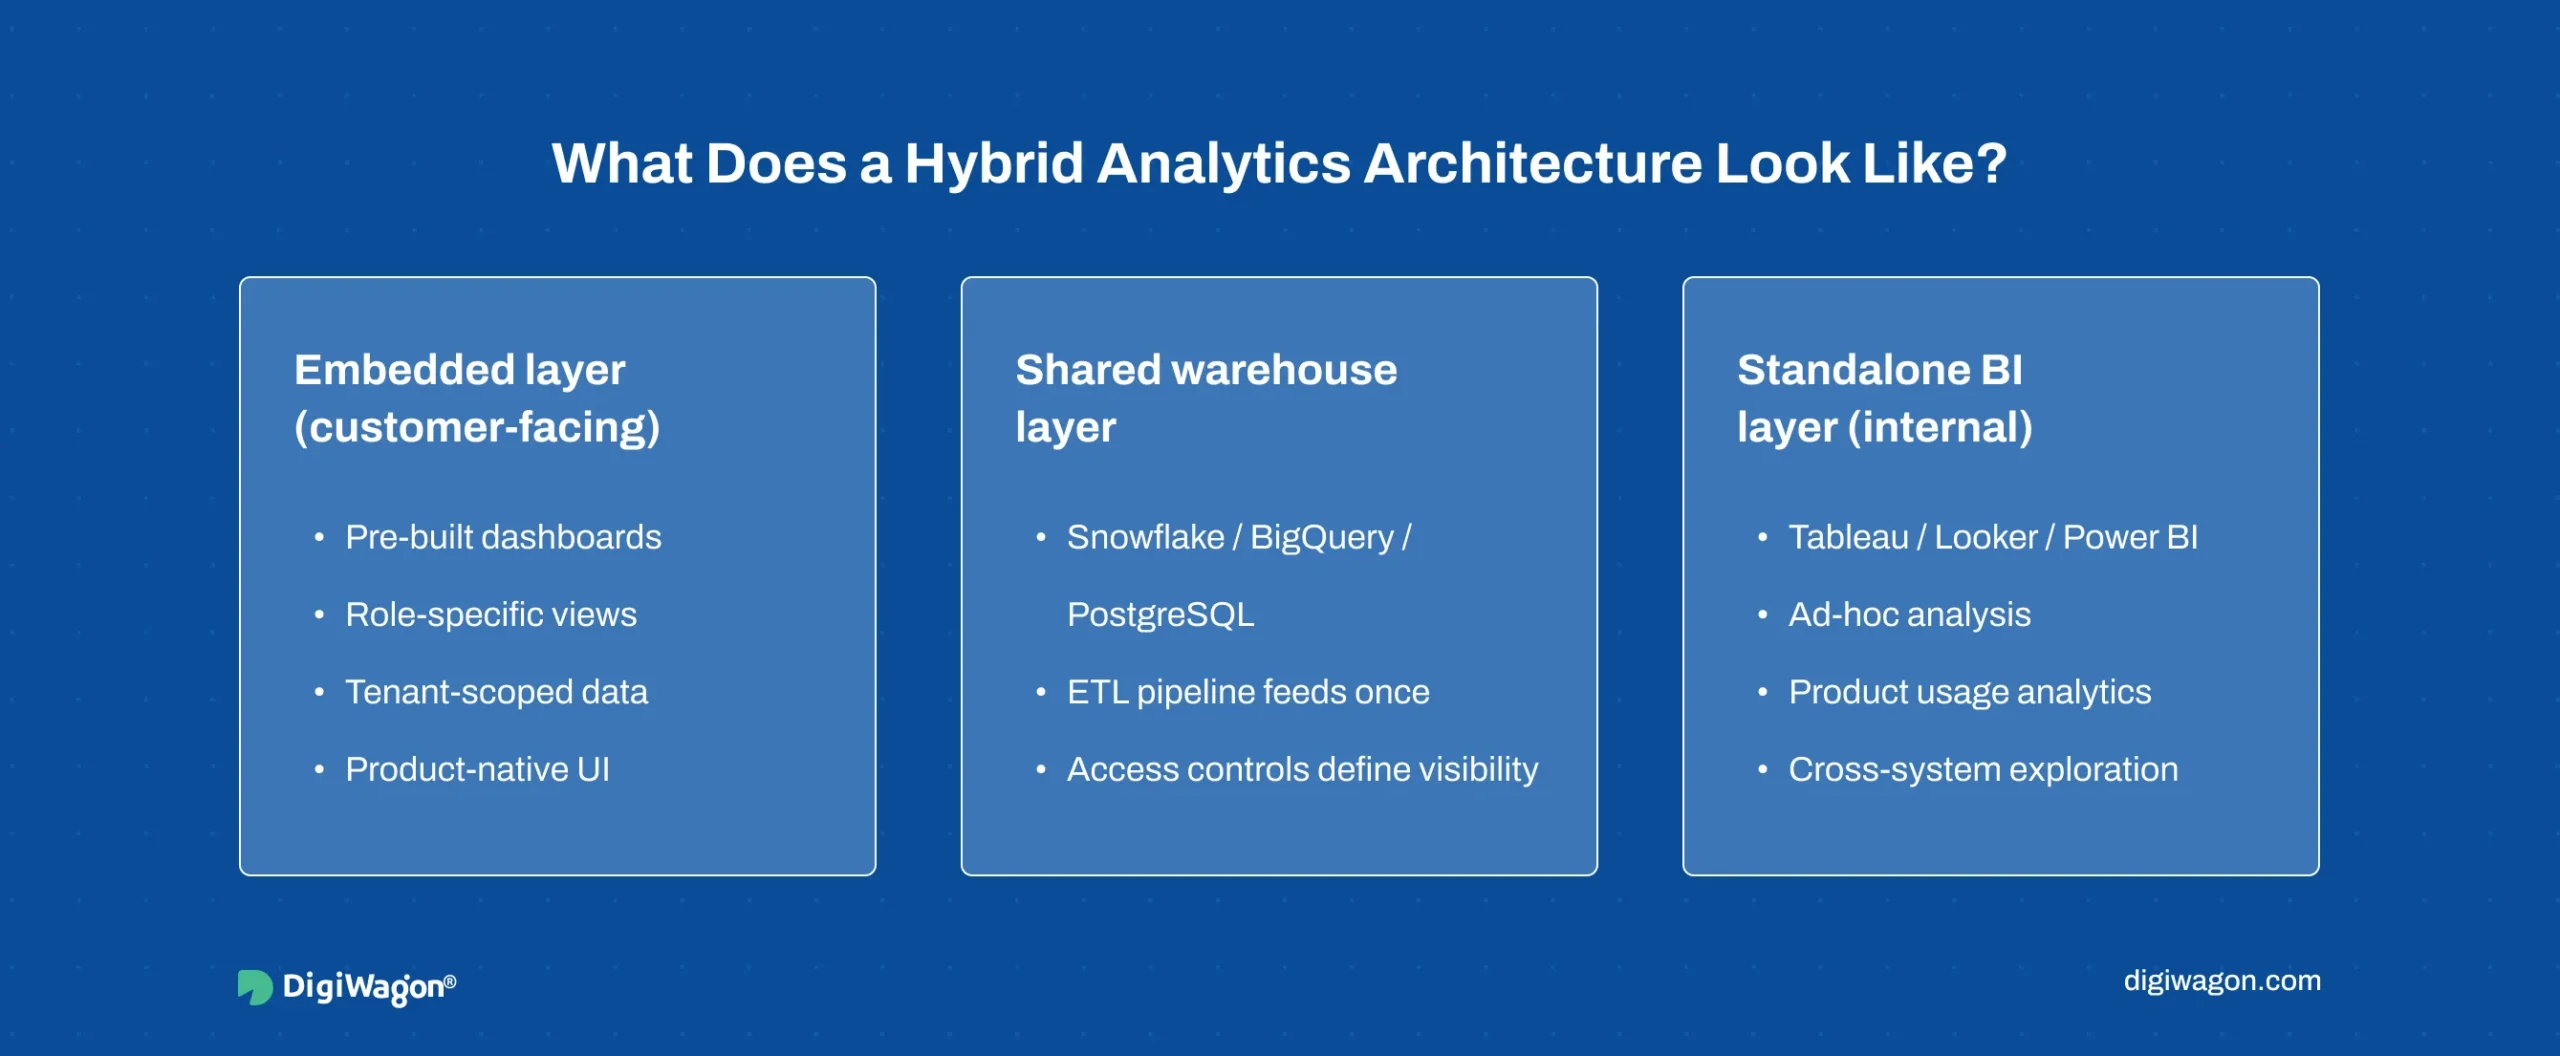
Many mature SaaS companies use both embedded analytics and standalone BI, but for different users and different reporting needs.
Embedded layer (customer-facing) Pre-built dashboards, role-specific views, and scheduled reports are delivered inside the product. Data is scoped to each tenant and the reporting experience is styled to match the product UI.
Standalone BI layer (internal) Tools such as Tableau, Looker, or Power BI connect to the same warehouse and are used by internal teams for ad-hoc analysis, product usage reporting, churn analysis, and operational decision-making. These workflows typically do not carry the same multi-tenancy constraints as customer-facing analytics.
Shared warehouse layer Both reporting layers query the same warehouse, whether that is Snowflake, BigQuery, or PostgreSQL. The ETL pipeline feeds the warehouse once, while access controls determine what is exposed to embedded users and what remains available for internal BI.
This hybrid model avoids a common failure pattern: forcing a standalone BI tool to serve customer-facing analytics, or expecting an embedded analytics layer to support deep internal exploration.
How Do Open-Source Options Compare to Commercial Platforms?
The open-source vs. commercial decision is the second-biggest architectural choice after embedded vs. standalone.
Metabase (open-source core + Pro/Enterprise tiers) offers interactive embedding where users query data inside your product. Fast to ship, but the embedded experience looks like Metabase, not your product, until you reach the Enterprise tier for white-label and sandboxing. Self-hosted.
Apache Superset (fully open-source) can be embedded via iframe, but multi-tenancy, white-labelling, and user management require custom engineering. Extremely flexible for teams with strong front-end engineering. Poor choice for teams wanting analytics shipped in weeks.
Commercial platforms (Embeddable, Qrvey, DataBrain, Luzmo) are purpose-built for SaaS embedding. Platforms like DataBrain enable product teams to integrate interactive dashboards in 2-4 weeks instead of the 6-12 months of custom development. The trade-off is vendor dependency and higher recurring cost.
| Platform | Multi-Tenancy | White-Label | Pricing Model | Best For |
|---|---|---|---|---|
| Metabase Pro/Enterprise | Enterprise tier | Enterprise tier | Per-user (self-hosted) | Open-source flexibility + optional embedding |
| Apache Superset | Custom engineering | Custom engineering | Free (infra only) | Engineering-heavy teams |
| Embeddable | Native | Full | Per-tenant | Developer-first native-feel dashboards |
| Qrvey | Native (multi-level) | Full | Capacity-based | Full-stack analytics with data lake |
| DataBrain | Native | Full | Per-tenant (tiered) | Fast deployment with AI insights |
| Luzmo | Native | Config-based | Per-tenant | Quick deployment with API sources |
Where DigiWagon Fits in the Analytics Architecture
DigiWagon helps SaaS teams choose analytics architecture based on how reporting needs to work inside the product, not just what a BI tool can do.
That includes:
- Deciding whether analytics should be embedded or kept in a standalone BI layer
- Designing multi-tenant, role-aware reporting models
- Choosing between open-source and commercial embedded analytics tools
- Aligning the warehouse, ETL, and dashboard layers into one scalable architecture
The goal is not just to add dashboards. It is to choose an analytics model that fits the product, the users, and the way reporting creates value over time.
Conclusion
The embedded analytics versus standalone BI decision is not just about reporting. It shapes how analytics fits into the product, how tenants access data, and how reporting creates value after launch.
Embedded analytics is usually the right choice when reporting is part of the customer experience. Standalone BI is stronger when internal teams need deeper analysis across systems. In many SaaS products, the most durable model is a hybrid one that supports both without duplicating the analytics foundation.
The right choice depends on how closely reporting is tied to the product itself.
Related reading: why BI dashboards fail and how data literacy fixes it, redesigning a legacy dashboard without losing power users and the real-time data pipeline that feeds operational dashboards. Our analytics and BI services cover both models.