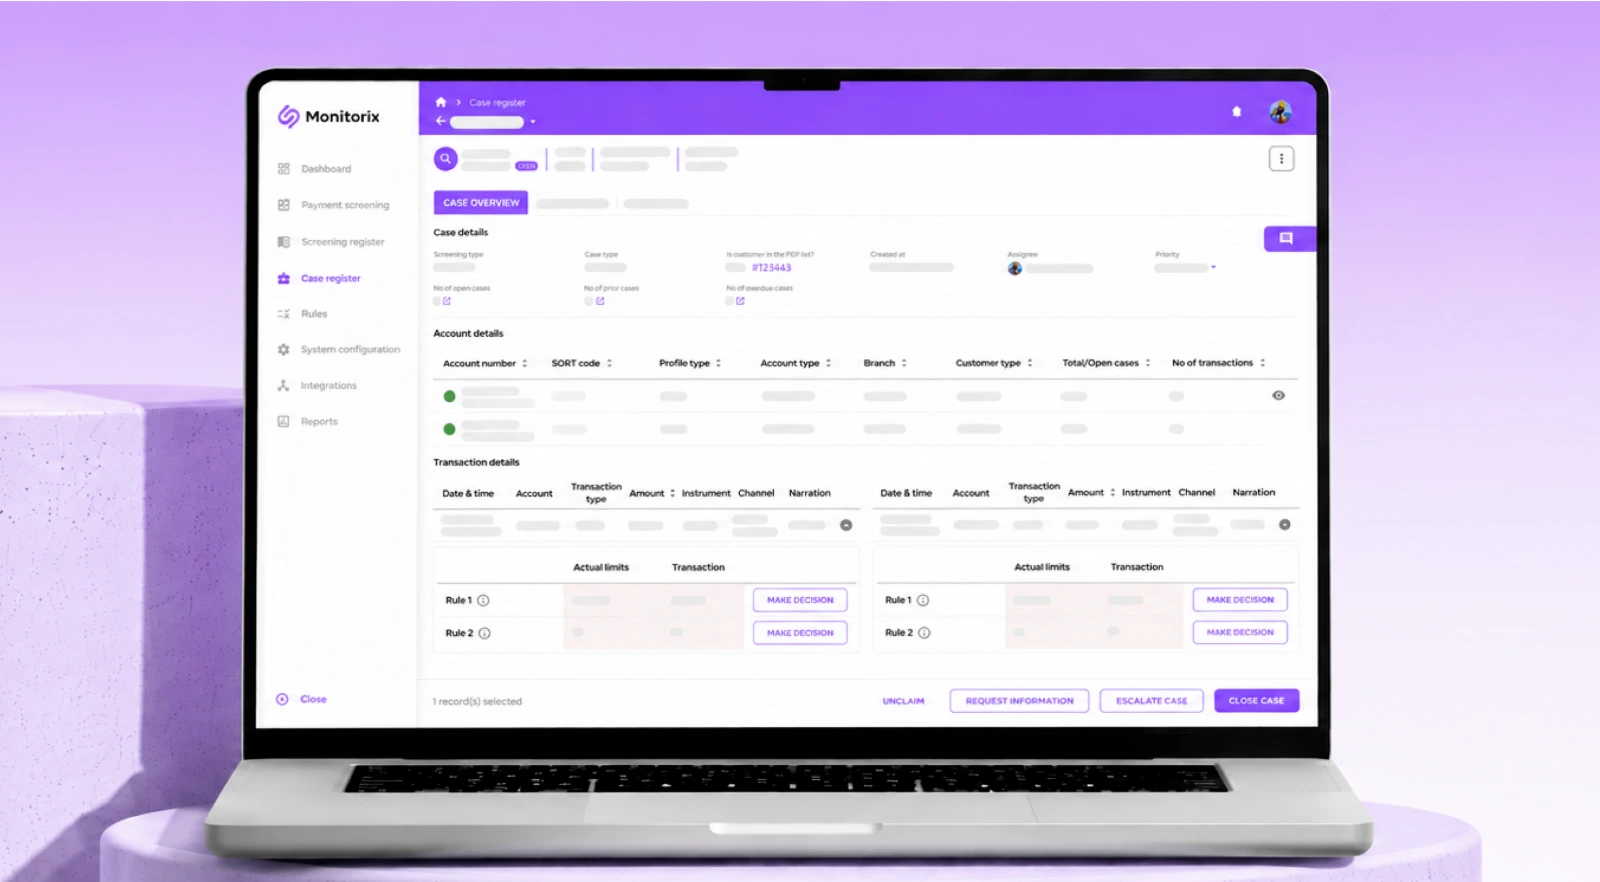
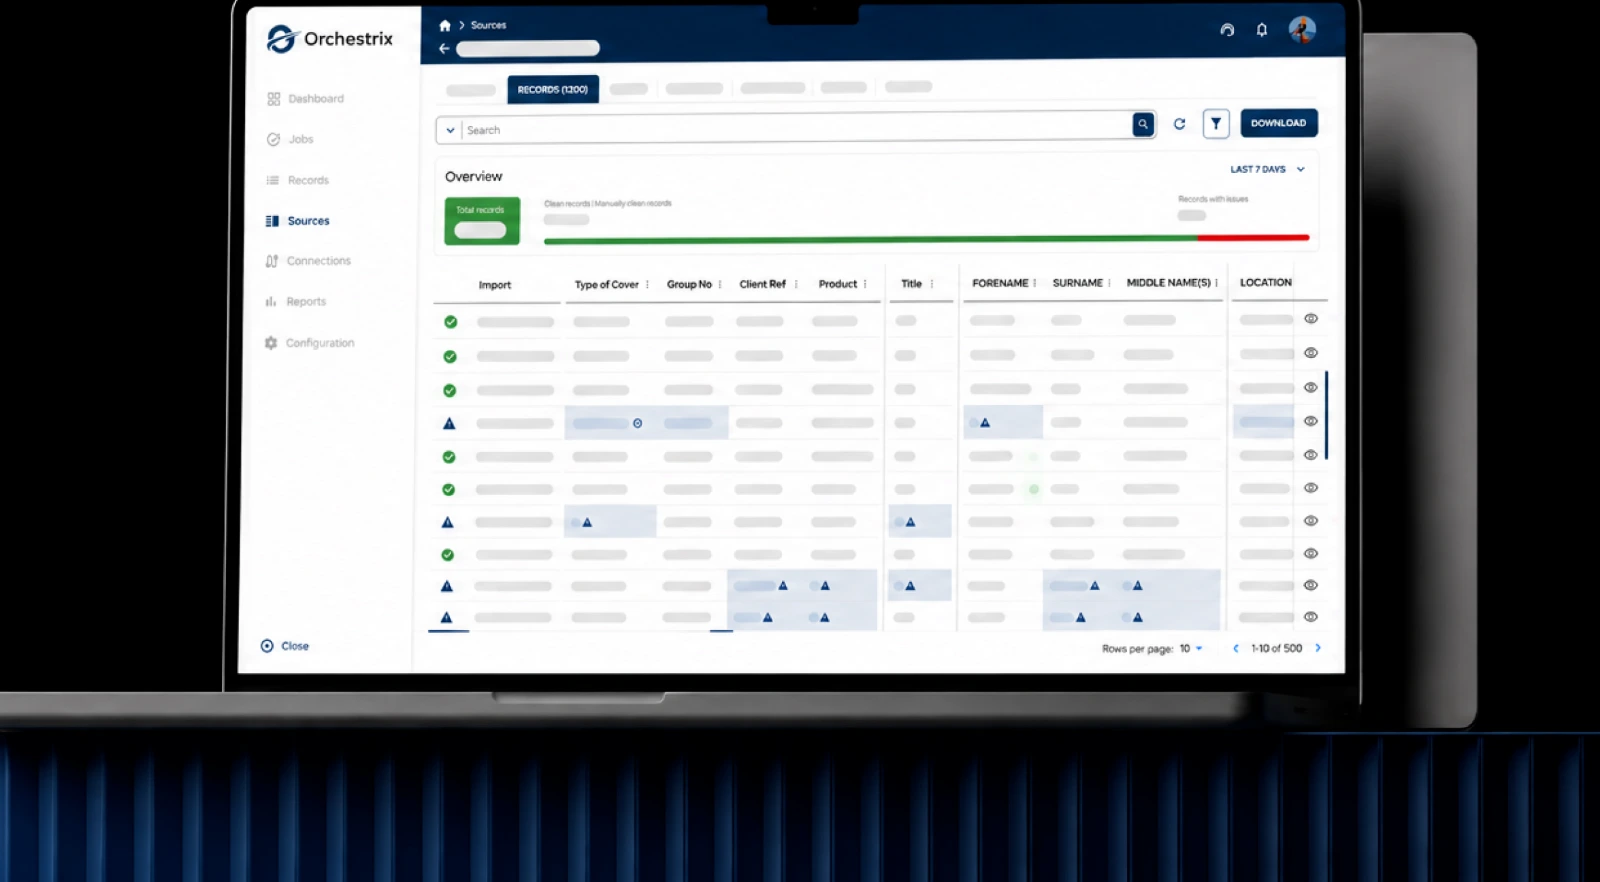
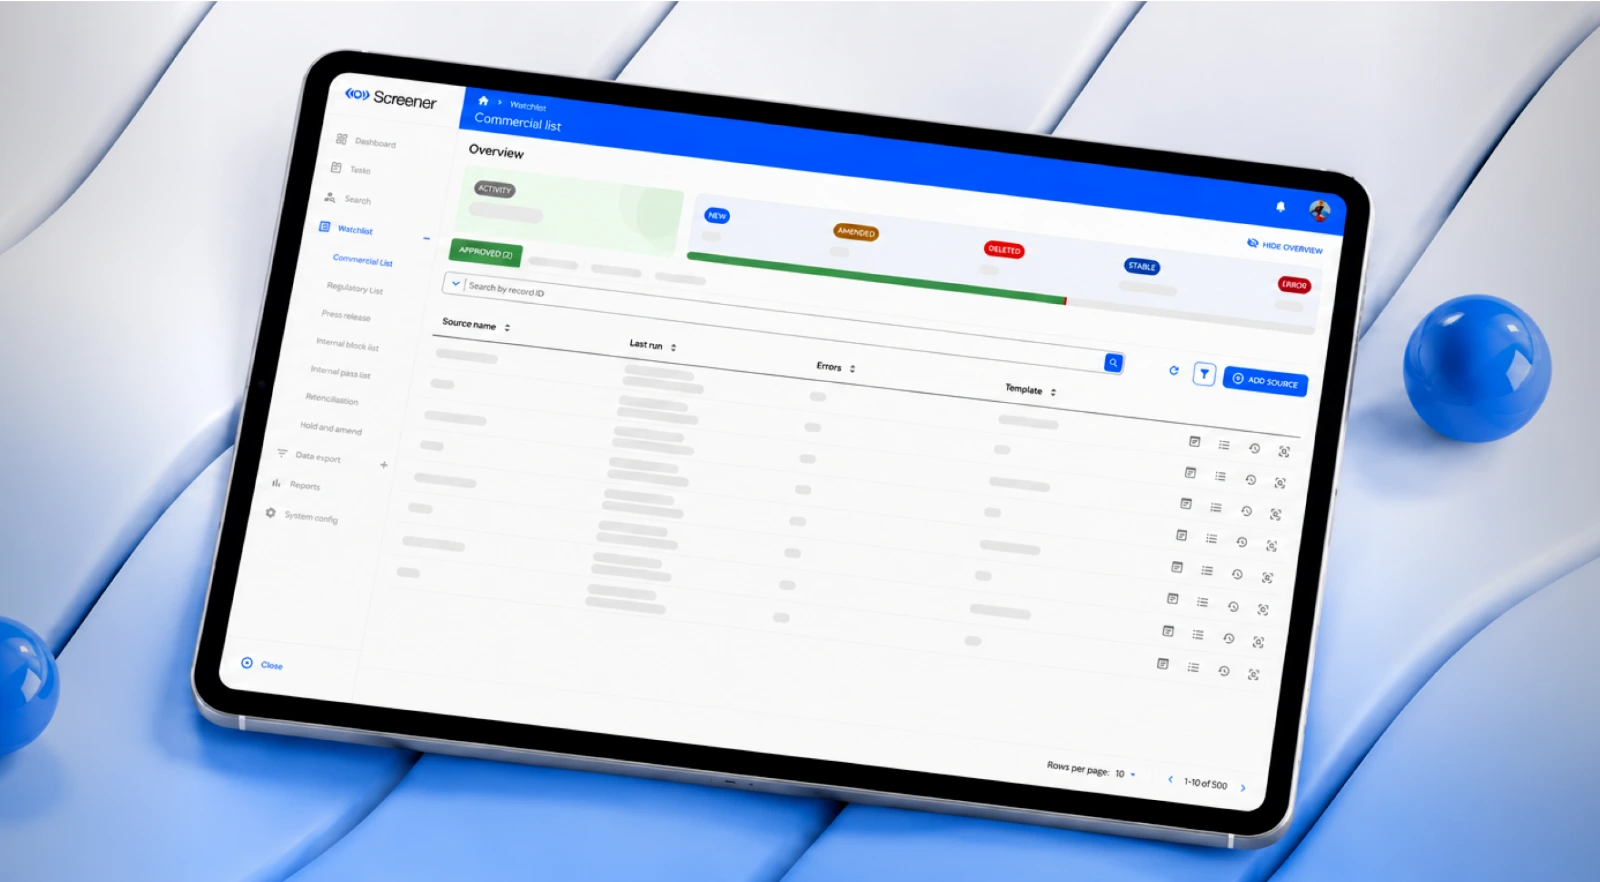
Bring metrics, reporting, and analytics into one trusted BI environment. We help teams see performance clearly, explore what changed and make decisions with confidence.
Revenue, margin, active customers or conversion are each calculated slightly differently depending on which report you open, and both sides can defend their number.
What we would change
What you could end up with
One definition per metric, applied everywhere it is reported
A shared business layer that dashboards and AI both read from
Governance over who can change a definition, and how
When teams rely on different reports and different definitions of the same metric, decisions slow down. We create a clearer BI environment with shared metrics, practical reporting, and analytics people can actually use.
01
BI Strategy, KPI & Reporting Design
Define what matters, how it should be measured, and which reports different teams need.
BI RoadmapsKPI FrameworksReporting StrategyMetrics DesignAnalytics Requirements
02
Semantic Models & Governed Metrics
Create a shared business layer, so important measures are calculated the same way across dashboards and reports.
Users should not have to open report after report to understand what has changed. AI can help them ask questions, compare performance and surface what needs attention, while answers remain grounded in approved business metrics.
01
Ask Your Data
Let users ask questions in natural language and receive answers based on governed metrics and BI models.
Example“Why did loan approval rates decline this month, and which customer segments were most affected?”
02
AI-Generated Insight Summaries
Surface important movements and KPI changes directly alongside dashboards.
ExampleHighlight which departments or service areas contribute most to longer patient wait times.
03
Anomaly & Change Detection
Spot unusual movements early and show users where the change began.
ExampleFlag a sudden increase in production defects and identify when the pattern started.
04
Conversational BI & Copilots
Let users explore reports, compare periods, and navigate metrics through conversation.
ExampleAsk a Power BI Copilot to compare payment failures across channels and highlight the biggest differences.
05
AI-Assisted Report Creation
Help analysts create calculations, visualizations and report narratives faster while staying within governed definitions.
ExampleGenerate an initial production dashboard using approved output, downtime, and quality metrics.
A useful dashboard in lending looks very different from one on a factory floor. We shape BI around the decisions, metrics and operating realities of each industry.
01 / 09
FinTech
01Portfolio Performance
02Loan Funnels
03Payment Analytics
04Delinquency Trends
05Risk & Revenue Reporting
02 / 09
RegTech
01Compliance Dashboards
02Regulatory Metrics
03Exception Monitoring
04Audit Reporting
05Control Visibility
03 / 09
InsurTech
01Claims Performance
02Policy Analytics
03Loss Ratios
04Customer Trends
05Operational Reporting
04 / 09
Healthcare
01Patient Flow
02Utilization
03Wait-Time Analytics
04Operational Performance
05Clinical & Management Reporting
05 / 09
Manufacturing
01Production Output
02Downtime
03Quality Metrics
04OEE
05Maintenance & Plant Performance
06 / 09
Retail & eCommerce
01Sales Performance
02Conversion
03Customer Behavior
04Inventory
05Product & Campaign Analytics
07 / 09
Logistics & Supply Chain
01Shipment Performance
02Delivery SLAs
03Inventory Visibility
04Carrier Analytics
05Operational Exceptions
08 / 09
SaaS & Technology
01Product Usage
02Adoption
03Retention
04Revenue Metrics
05Customer Health
09 / 09
Defence
01Operational Dashboards
02Asset Readiness
03Resource Utilization
04Controlled Reporting
05Mission-Support Analytics
Our work
Data & Analytics in practice.
Engagements from the wider Data & Analytics practice this service sits in — 3 of them written up in full.
We agree what each number means before anyone designs a screen for it, then keep the environment governed as reports and teams multiply around it.
01
Frame the Decisions
Establish which decisions the reporting has to support, who makes each one, and what they currently do when the dashboard does not answer it.
Focus
DecisionsRolesKPIsGaps
02
Define the Metrics
Agree one calculation per measure and put it in a semantic layer, so dashboards, self-service and AI assistants all read the same definition.
Focus
Semantic layerDefinitionsModelsOwnership
03
Build for the Reader
Design each view around what its audience has to notice, with drill-down to the record behind the headline and embedded analytics where the work happens.
Focus
DashboardsDrill-downSelf-serviceEmbedding
04
Govern and Rationalize
Watch what is actually used, retire what is not, tune the refreshes that cost the most, and keep access and publishing standards in place as the estate grows.
Focus
UsageRationalizationPerformanceAccess
Frame01 Frame the DecisionsDefine02 Define the MetricsBuild03 Build for the ReaderGovern04 Govern and Rationalize
Insights
Thinking Behind Better Reporting.
Perspectives on why dashboards fail, what a semantic layer actually buys you, and how analytics earns its place in a decision rather than a meeting.
Data & Analytics
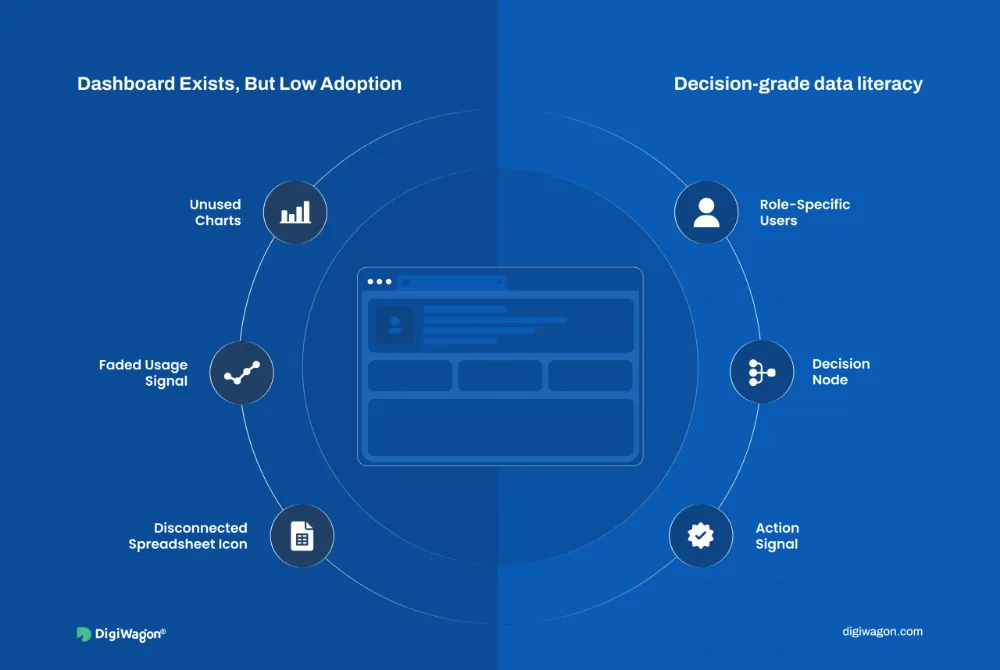
Why BI Dashboards Fail: Enterprise Data Literacy Playbook
· Kartik Gajjar · 7 min read
Data & Analytics
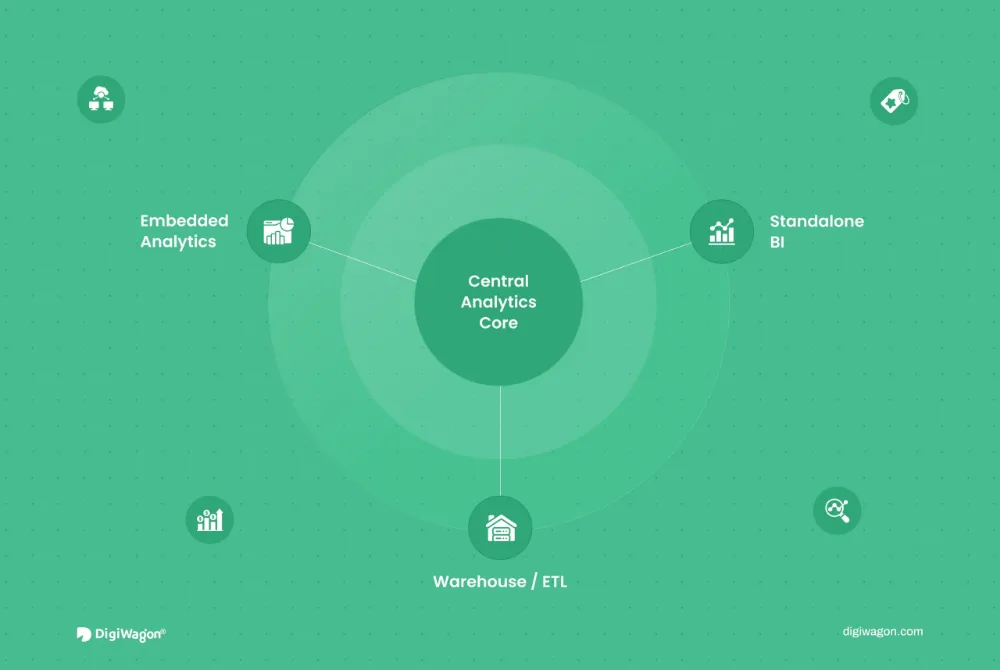
Embedded Analytics vs. Standalone BI: Which Reporting Architecture Fits Your SaaS Product?
· Jigar Vavadia · 8 min read
Experience Design
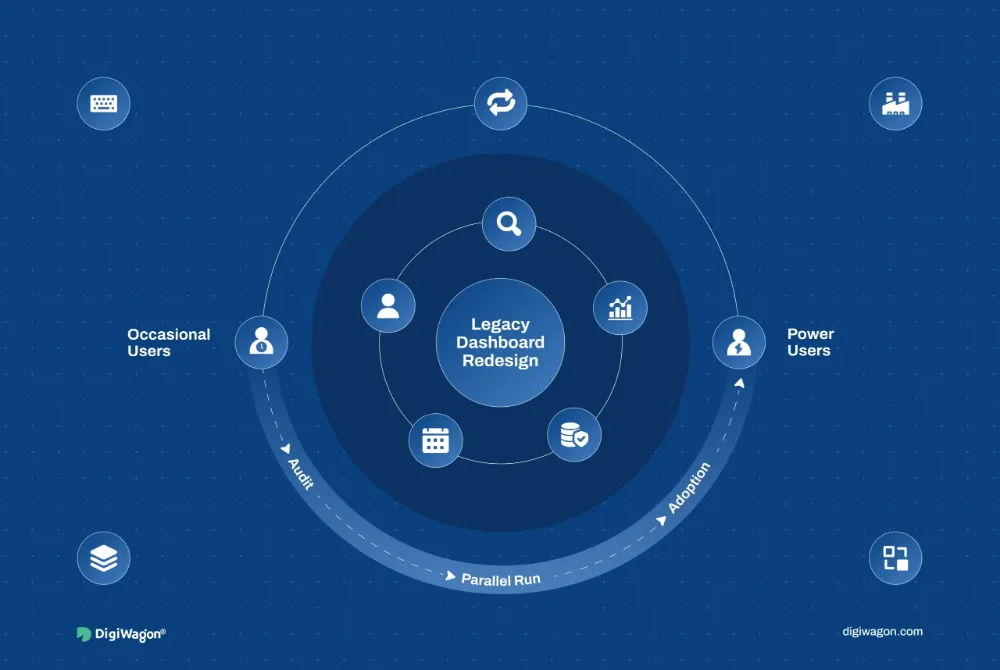
Redesigning a Legacy Dashboard Without Losing Power Users
Straight answers on what business intelligence services and BI consulting actually cover, why dashboards fail, what a semantic layer is, and how Power BI, Tableau and Looker differ.
01What does business intelligence consulting include?
Business intelligence consulting can cover BI strategy, KPI definition, semantic modelling, dashboard design, implementation, governance and adoption. The aim is to create a reporting environment where teams work from the same definitions and have a consistent view of business performance.
02Why do BI dashboards fail?
Dashboards often fail because metrics are unclear, data is inconsistent, or reports become too complicated. They can also fail when users cannot connect what they see to a decision. Strong BI starts with trusted data, shared definitions, and reporting designed around real business questions.
03What is a semantic layer in business intelligence?
A semantic layer translates underlying data into shared business terms such as revenue, margin, or conversion. It gives dashboards, self-service analytics and AI assistants the same foundation, reducing the risk of different teams calculating the same metric differently. Without one, the same measure ends up defined separately in every report that uses it.
04Power BI vs Tableau vs Looker: Which is better?
There is no single best BI platform. Power BI often suits organizations already using the Microsoft ecosystem. Tableau is strong for flexible visual exploration, while Looker works well for governed, model-driven analytics. The right choice depends on your systems, users, and reporting requirements.
05How can AI be used with business intelligence?
AI can support natural-language queries, conversational BI, automated summaries, anomaly detection, and assisted report creation. For reliable results, these capabilities should work with governed metrics and trusted BI models rather than interpreting raw business data without context. The governed metric layer is what keeps the answers trustworthy.
06How is Business Intelligence different from Data Science?
Business Intelligence focuses on metrics, reporting, and visibility into performance. Data Science goes deeper into statistical analysis, experimentation and causal investigation when teams need to understand why something happened or test what may happen next. BI tells you what the number is; data science tells you what is moving it.
Bring Clarity to Every Business Decision
Connect trusted metrics, clear dashboards and AI-assisted analytics so teams can understand performance and act with confidence.
One click opens the assistant you already use with a question that points it at this page, so the answer comes from what we publish, not a guess.
The question it opens withRead https://digiwagon.com/analytics-bi-services and explain how DigiWagon runs a Business Intelligence Consulting & Analytics engagement, what I should expect in the first 90 days, and how to judge whether a partner like this fits a team of our size. Stick to what the page says and mark anything you are not sure about.