Real-Time Data Pipelines for Manufacturing: Key Takeaways
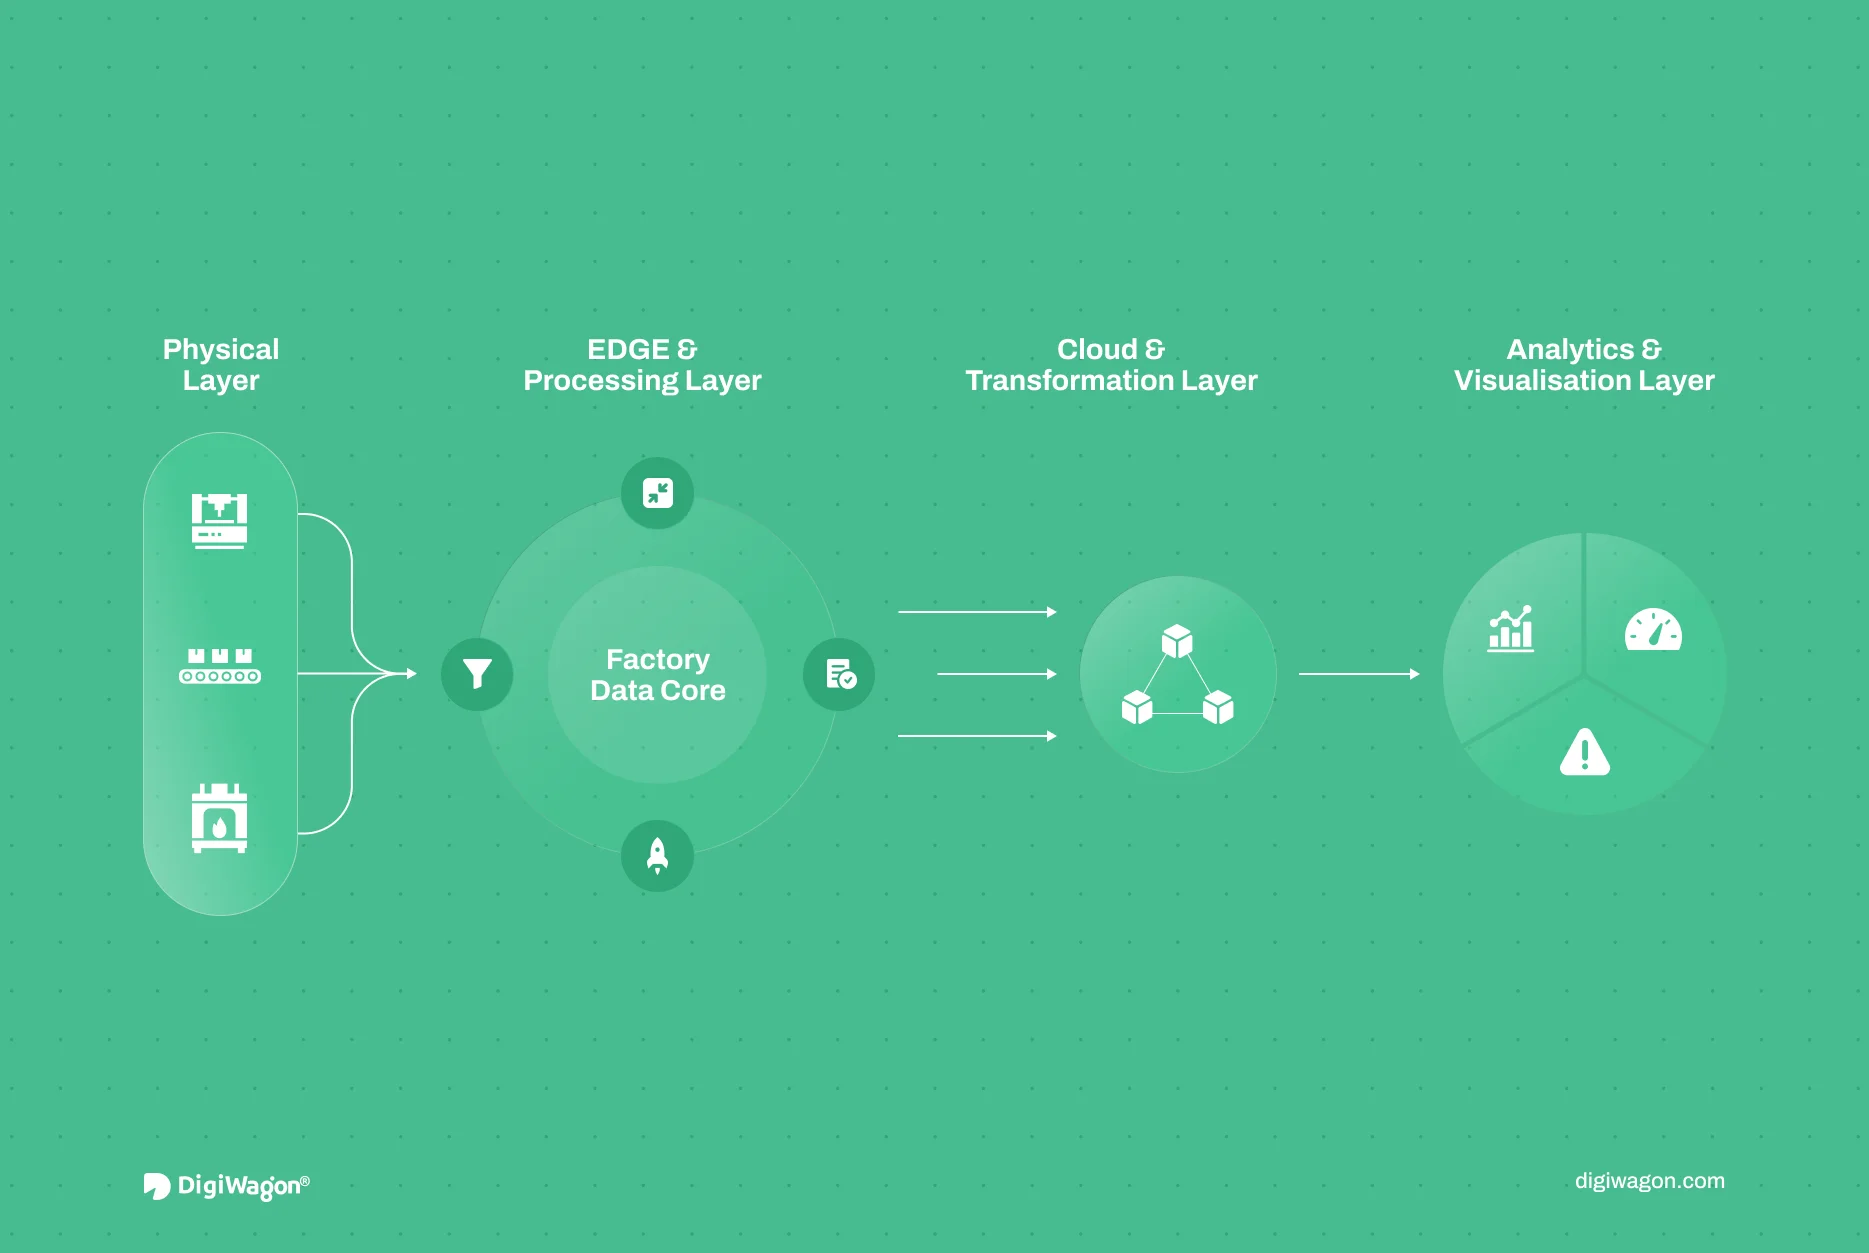
- A production-grade manufacturing pipeline has four stages: sensor ingestion, edge pre-processing, cloud transformation, and dashboard delivery. Edge processing alone reduces cloud-bound data by 70-90%.
- Most Industry 4.0 projects stall not at data collection but at data usability. Sensors are cheap. Pipelines that turn telemetry into shift-level OEE dashboards and maintenance alerts are not.
- The architecture must handle protocol diversity (OPC UA, MQTT, Modbus), air-gapped factory floors, and legacy equipment that predates the internet.
What Is a Real-Time Data Pipeline for Manufacturing?
A real-time data pipeline for manufacturing continuously ingests sensor telemetry and machine states from factory equipment, transforms them into operational metrics, and delivers those metrics to dashboards or ML models with seconds-level latency. Unlike batch ETL that processes data overnight, this pipeline runs continuously because a temperature spike on a furnace or a vibration anomaly on a CNC spindle cannot wait until tomorrow’s report.
Why Does Manufacturing Need a Different Data Pipeline?
Manufacturing data pipelines operate under constraints that enterprise data warehousing rarely faces.
Manufacturing leads all industries in IoT adoption, accounting for 34% of total IoT device deployments in 2025. A single CNC machine with vibration, temperature, and power sensors polling at 1-second intervals generates roughly 260 MB of raw telemetry per day. Multiply by 50 machines, and one production line produces 13 GB daily. Most of it is repetitive steady-state readings. The pipeline’s job is to separate the 2-5% that signals something meaningful from the 95% that confirms normal operation.
Three things make this harder than typical data engineering:
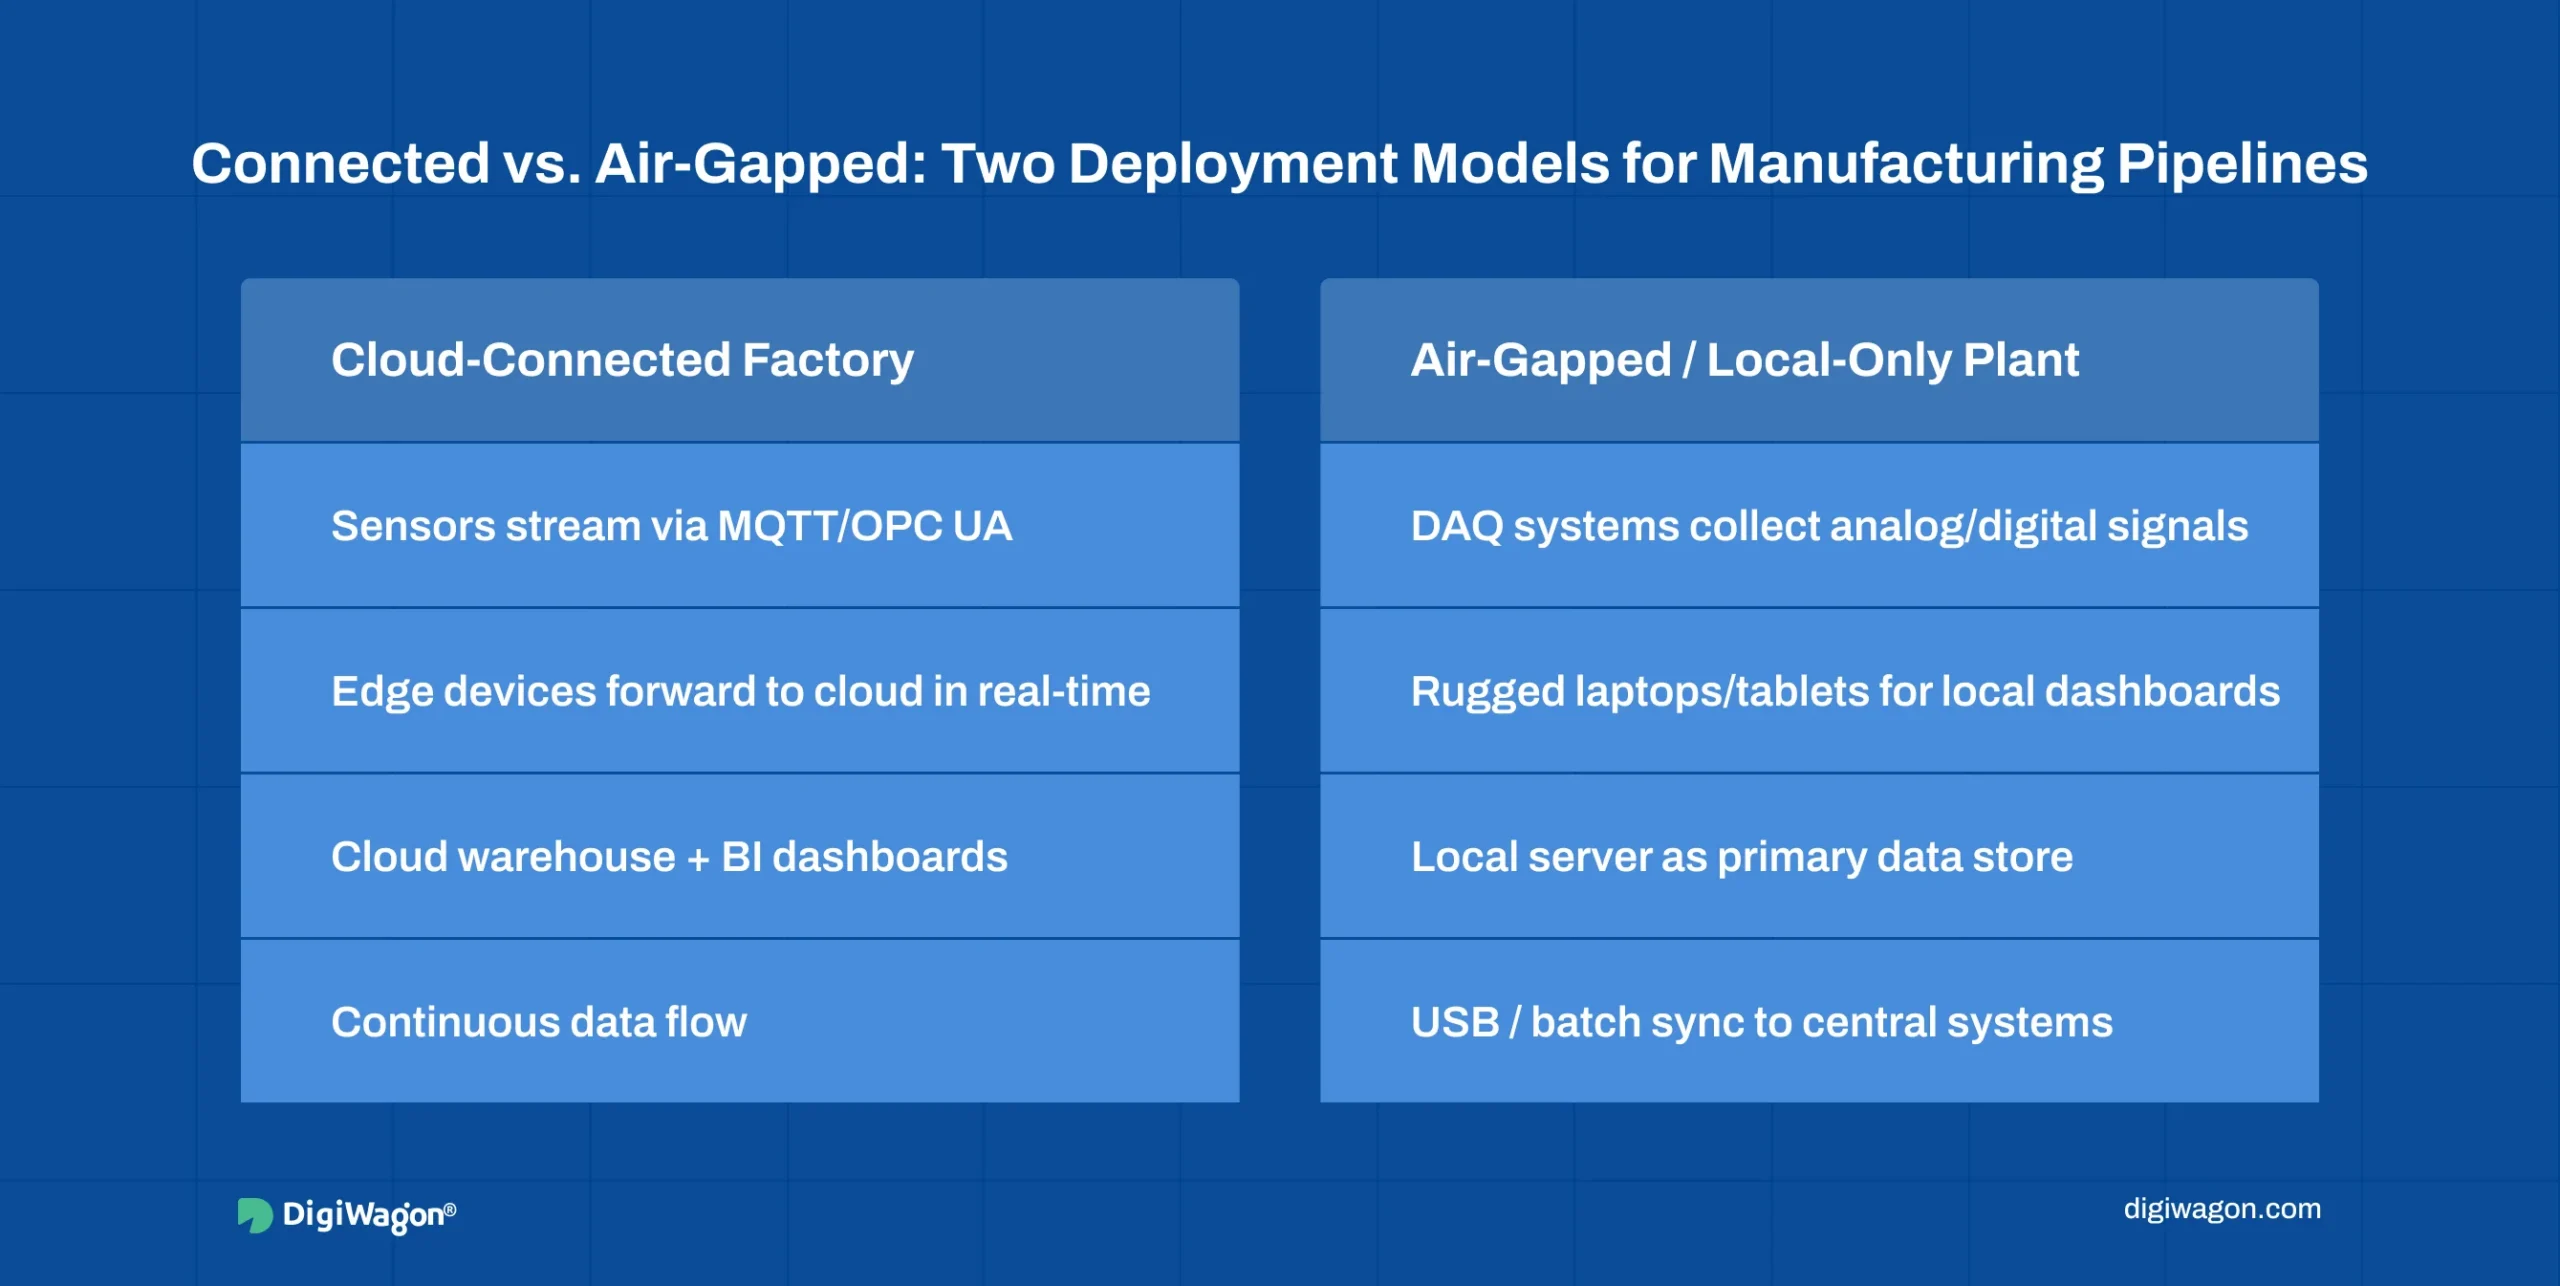
Connectivity is unreliable or nonexistent. Many factory floors operate on isolated local networks with no internet access. Foundries, mining operations, and remote manufacturing plants run fully air-gapped environments where data stays on-premises by design or by regulation. In these settings, DAQ (Data Acquisition) systems from vendors like National Instruments, Keysight, and HBK collect and store sensor data locally on industrial PCs or rugged laptops and tablets from Panasonic Toughbook, Getac, or Dell Rugged lines. Operators sync data manually via USB or local Ethernet transfers, or through periodic batch uploads when connectivity windows open. Even in connected factories, Wi-Fi coverage is patchy across large shop floors, and wired Ethernet does not reach every machine. The pipeline must handle all of these scenarios: continuous streaming, periodic batch sync, and manual data transfer.
Equipment speaks different protocols. Modern sensors use MQTT. PLCs and SCADA systems use OPC UA. Legacy equipment uses Modbus or proprietary serial interfaces. Some machines provide data only through vendor-specific APIs.
Latency is measured in seconds. A vibration anomaly needs an alert now, not a line item in tomorrow’s report. Enterprise BI can tolerate hours of delay. Manufacturing cannot.
Real-time manufacturing data collection is the first stage of the pipeline, not the whole of it. Collecting the signal – from a PLC over OPC UA, a retrofitted sensor over MQTT, a legacy controller through a protocol gateway – is largely a solved problem. What decides whether the data is useful is what happens next: how much of it is filtered at the edge, how it is joined to shift, batch and product context, and how quickly it reaches the person who can act on it.
The Four-Stage Real-Time Data Pipeline Architecture
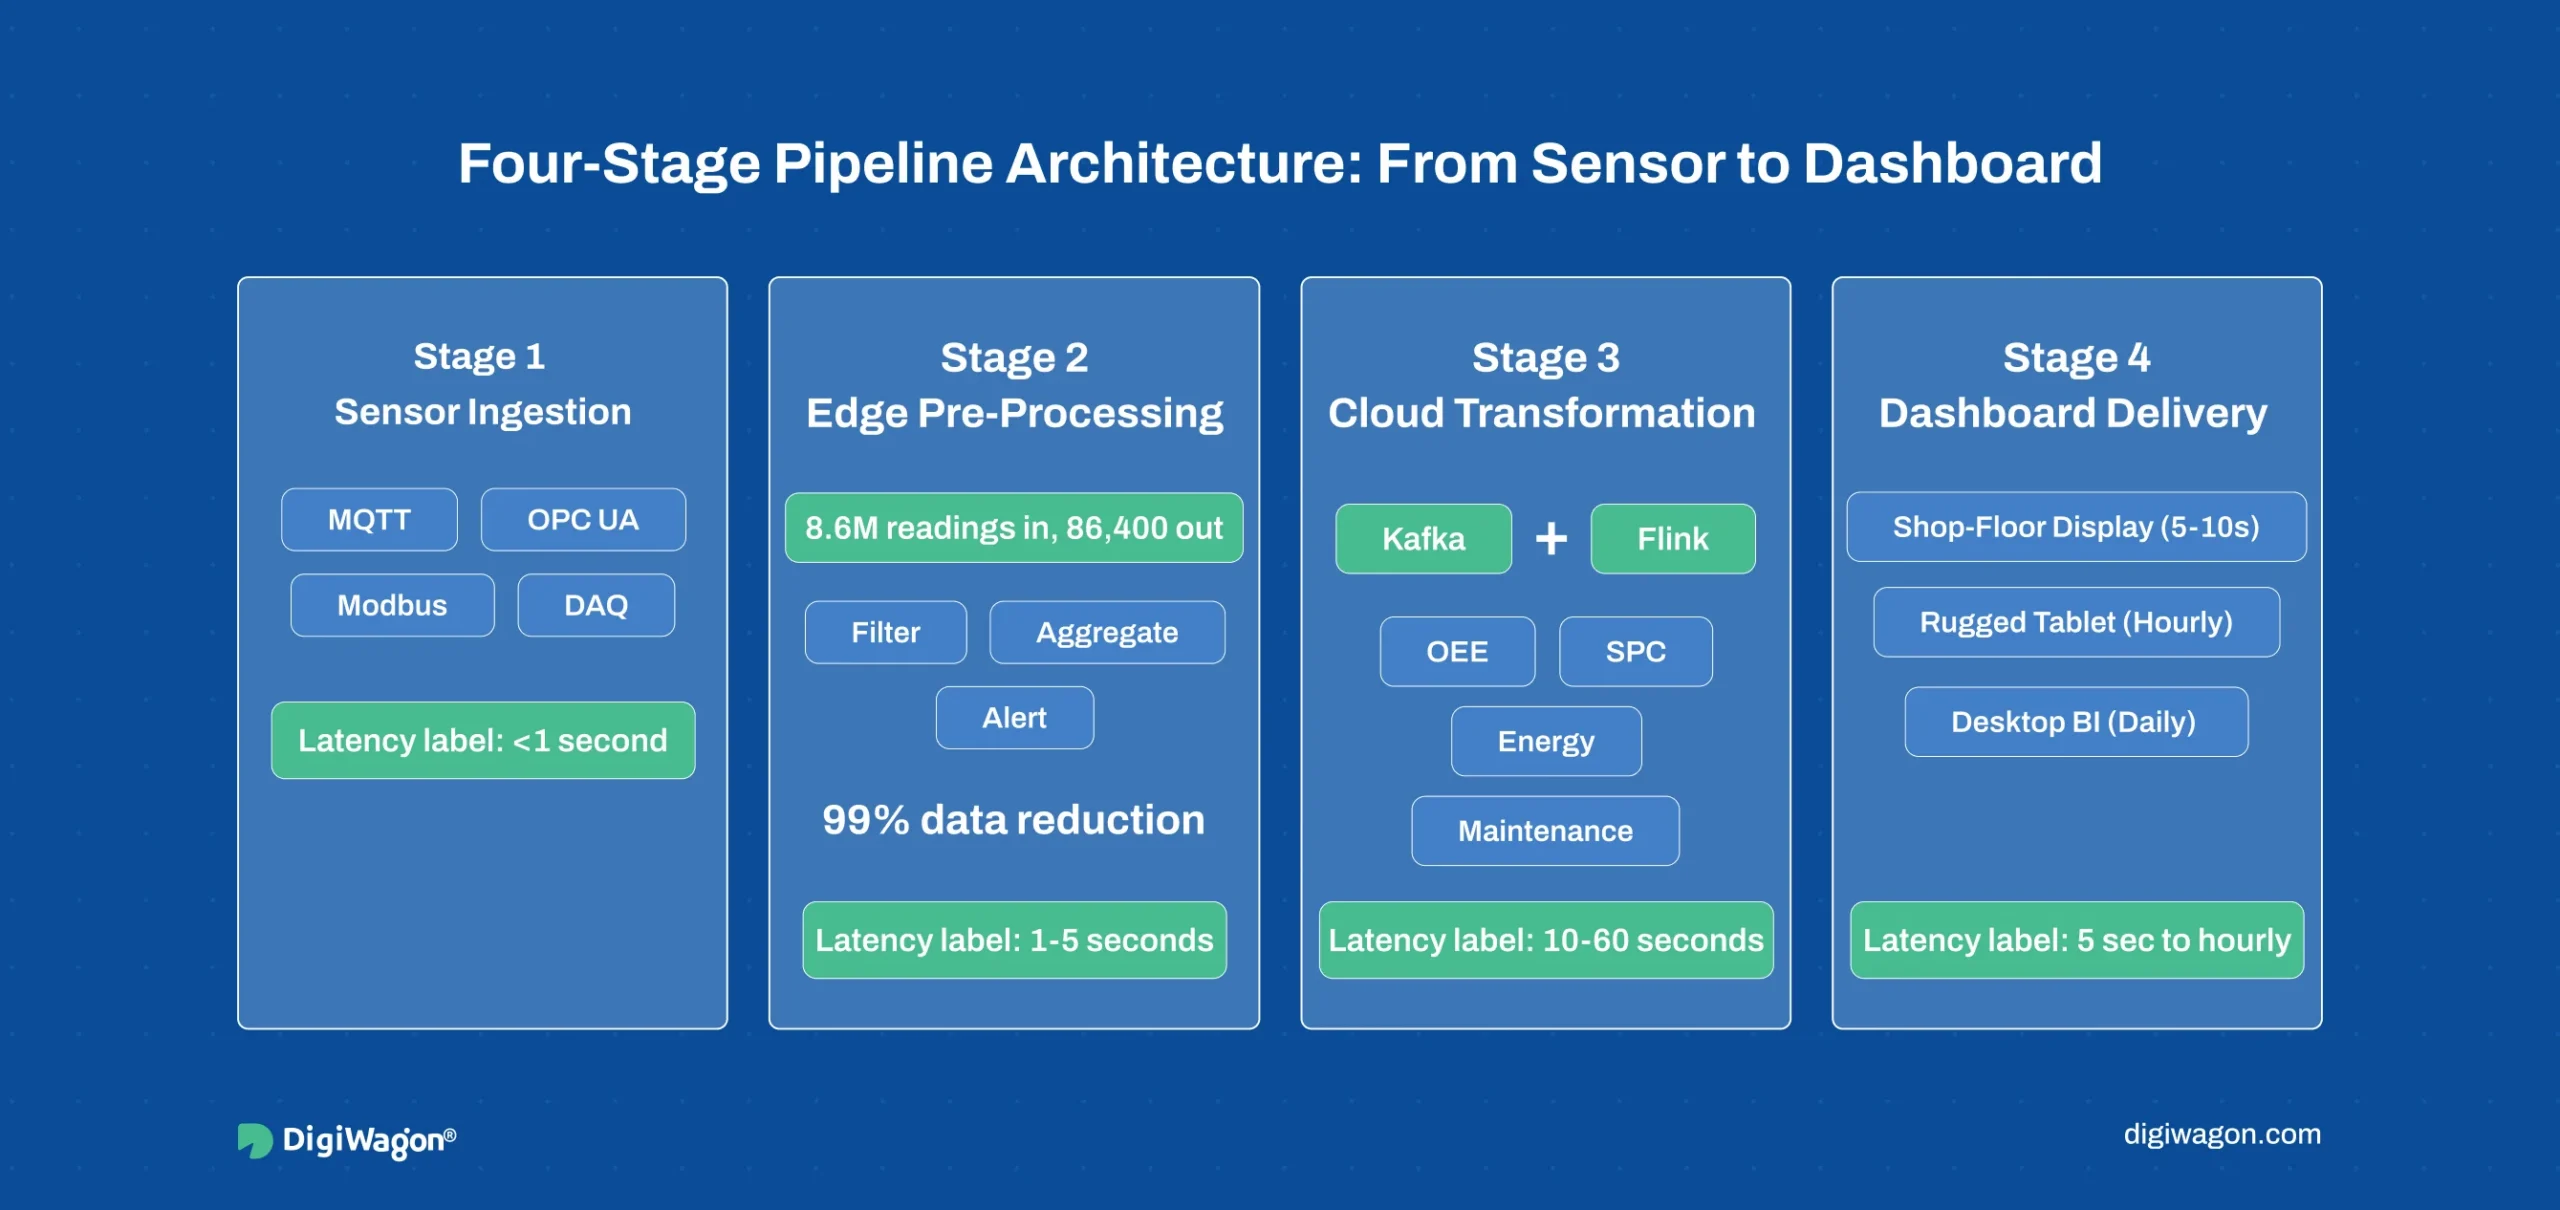
Stage 1: Sensor Ingestion
The ingestion layer connects to equipment and pulls raw telemetry. The challenge is protocol diversity.
- MQTT: Lightweight publish-subscribe, good for high-frequency IoT sensors
- OPC UA: The industry 4.0 standard, structured and self-describing, common on PLCs and SCADA
- Modbus: Serial or TCP, minimal data structure, found on legacy equipment
- DAQ systems: National Instruments cDAQ, Keysight DAQ970A, and similar hardware collecting analog signals from older machines that have no digital interface at all
- Proprietary APIs: Vendor-specific interfaces for specialised equipment
We use a gateway pattern: edge devices on each production line running protocol-specific adapters that normalise incoming data into a common message format (JSON with timestamp, machine ID, sensor type, value) before forwarding upstream.
Polling frequency is a design decision within any real-time data pipeline for manufacturing. Temperature on a furnace: 1-second. Ambient humidity: 5-minute. Motor power draw: sub-second for anomaly detection, 1-minute average for dashboards. One frequency for everything wastes bandwidth or misses events.
Stage 2: Edge Pre-Processing
This is the layer most projects underestimate when building a real-time data pipeline for manufacturing. Sending raw telemetry at full resolution to the cloud is expensive and slow. In air-gapped or limited-connectivity environments, edge processing is not just an optimisation. It is the only option.
- Dead-band filtering: Discard readings unchanged beyond a configurable threshold since last transmission
- Rolling aggregation: Compute 1-minute averages, min/max, and standard deviation from 1-second raw data
- Threshold alerting: Flag readings exceeding high/low bounds and forward immediately
- Local buffering: Store data during network outages or in air-gapped environments, forward when connectivity resumes or during scheduled sync windows
The math is concrete. A vibration sensor at 100 Hz generates 8.6 million readings per day. After dead-band filtering and 1-second RMS aggregation at the edge, the cloud (or local server) receives 86,400 data points. Same diagnostic value. 1% of the bandwidth.
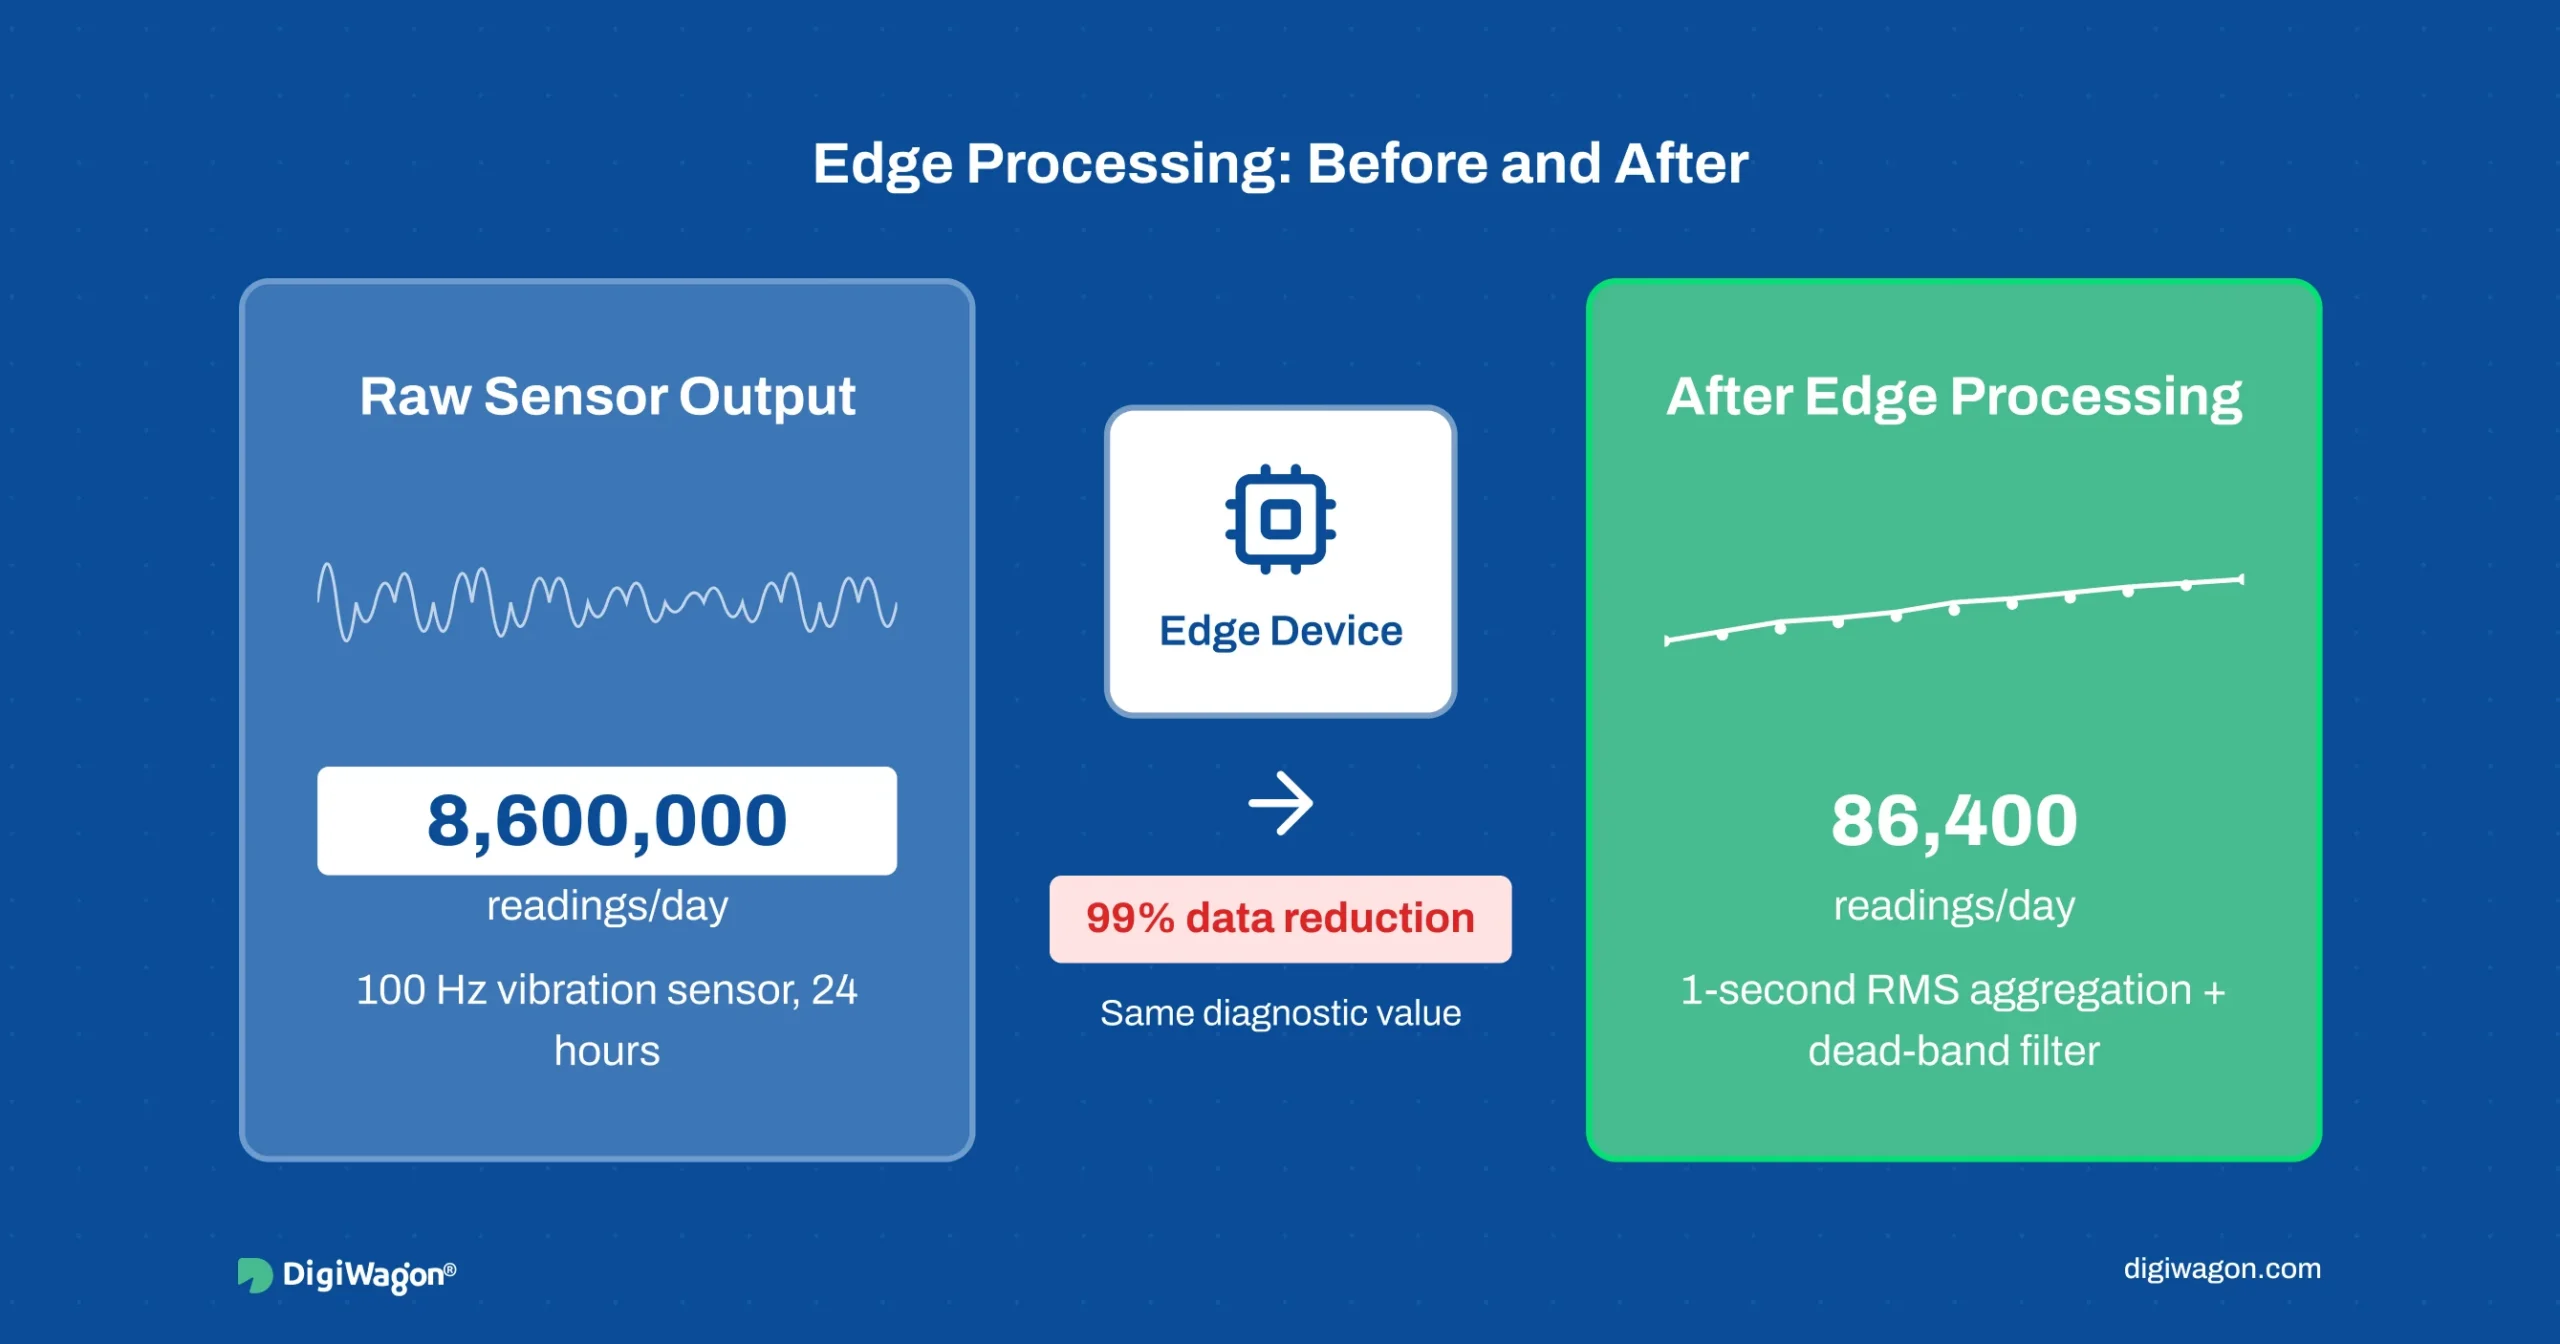
For fully air-gapped plants, edge devices with local storage (industrial SSDs, ruggedised NAS units) serve as the primary data store. DAQ hardware with onboard processing handles both collection and first-pass filtering. Operators review dashboards running on local servers or rugged tablets on the shop floor, with data synced to central systems on a scheduled basis.
Stage 3: Cloud Transformation & Contextual Enrichment
Raw sensor values, even after edge processing, are not actionable. “Motor 7 vibration: 4.2 mm/s RMS” means nothing without context. Is that normal for this motor? Is it trending upward? Is the motor running a heavy production order?
The cloud (or on-premises data centre) layer joins sensor telemetry with MES and ERP data: which product is on which line, what maintenance was last performed, what the production schedule looks like. Apache Kafka handles stream ingestion. Flink or Spark Structured Streaming handles real-time joins. Batch jobs handle historical context.
Key transformations:
- OEE (availability x performance x quality) per shift, line, and machine
- SPC metrics from quality inspection data
- Energy normalisation: kWh per unit, adjusted for product type
- Maintenance tracking: Hours since last service vs. recommended thresholds
This is where manufacturing data engineering connects to traditional data engineering and ETL services. The patterns are the same. The domain context is different.
Stage 4: Dashboard Delivery
Different roles need different views at different refresh rates.
- Shift supervisors: Real-time line status board (5-10 second refresh) showing which machines are running, current throughput vs. target
- Maintenance teams: Predictive maintenance view (hourly refresh) showing vibration trends, temperature drift, hours since service
- Plant managers: Daily OEE summary with drill-down to shift and machine level
The dashboard architecture follows the same embedded vs. standalone trade-off from our embedded analytics vs standalone BI guide. Shop-floor displays, rugged tablets, and operator terminals need embedded views inside the MES. Plant managers doing ad-hoc analysis need a standalone BI tool connected to the time-series warehouse.
| Stage | Function | Latency Target |
|---|---|---|
| Sensor Ingestion | Protocol adaptation, raw capture | <1 second |
| Edge pre-processing | Filtering, aggregation, alerting | 1-5 seconds |
| Cloud Transformation | Contextual enrichment, OEE/SPC | 10-60 seconds |
| Dashboard Delivery | Role-based operational views | 5 sec to hourly |
A real-time data pipeline helps manufacturers turn machine data into faster, clearer decisions. By moving data from sensors to edge processing, cloud transformation, and live dashboards, teams can spot issues earlier, reduce downtime, and improve factory performance.
What Are the Most Common Architecture Mistakes?
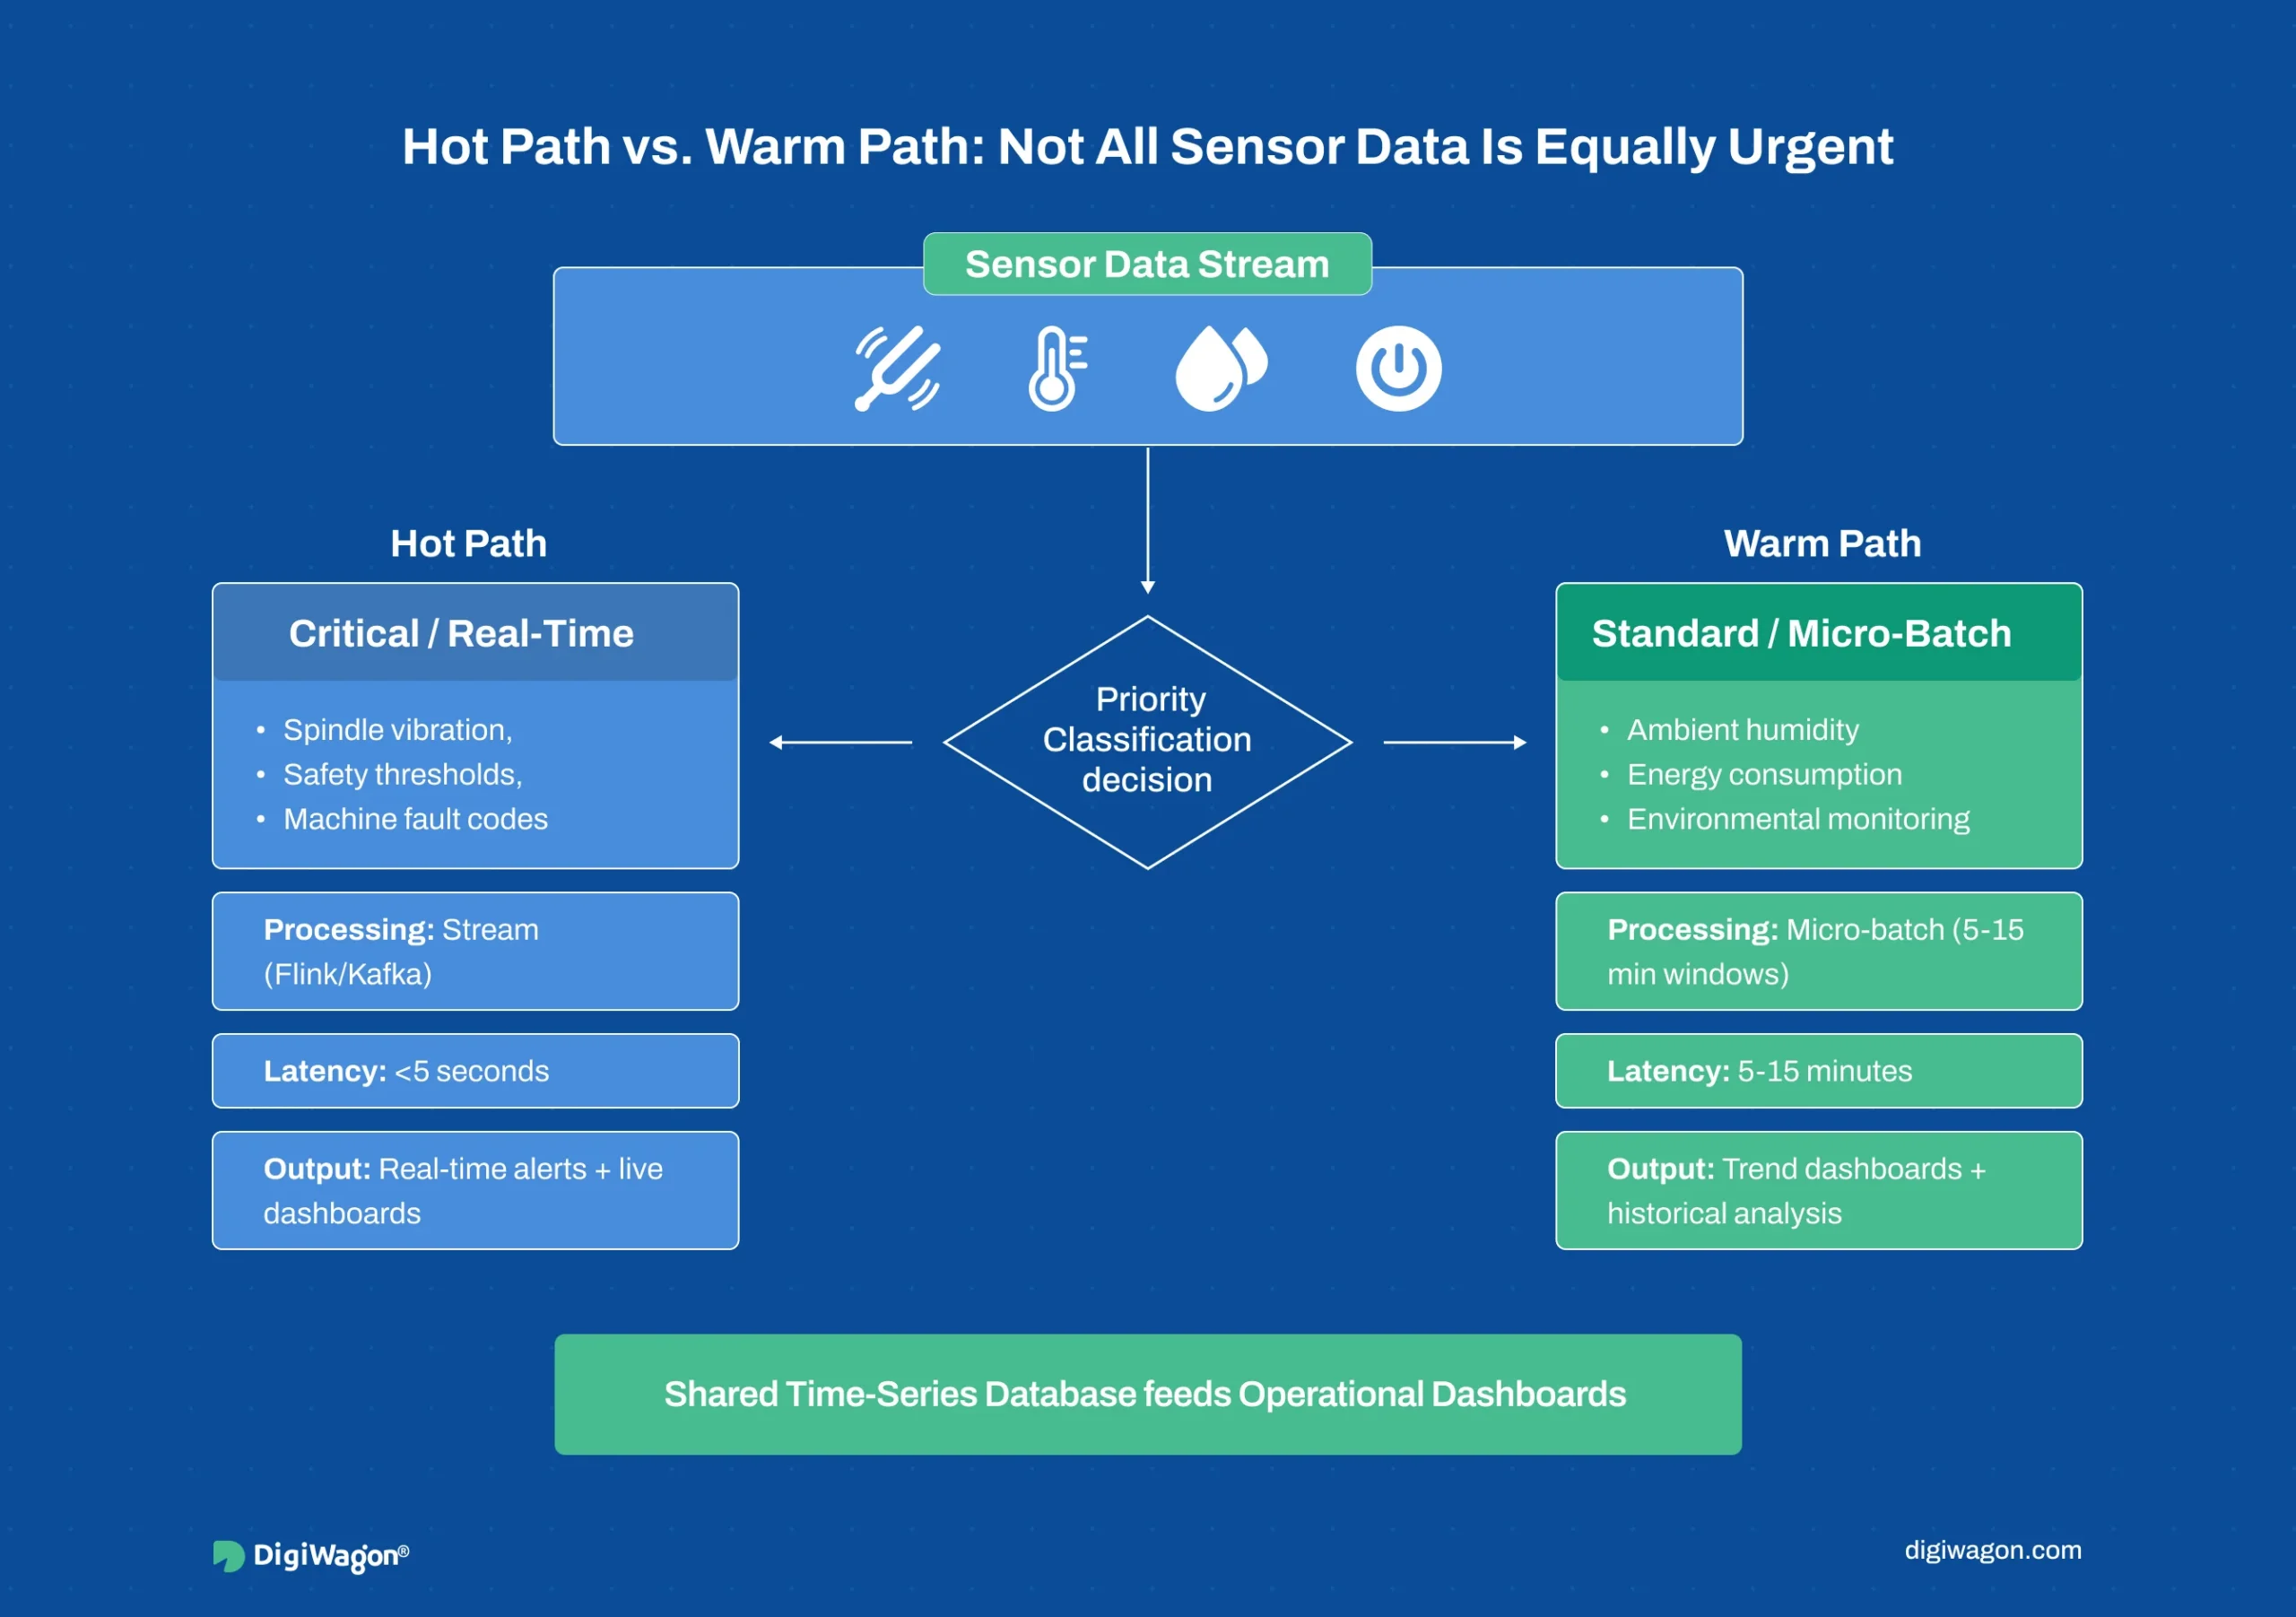
Treating all sensor data as equally urgent. A vibration anomaly on a critical spindle needs sub-second alerting. A warehouse humidity reading needs daily averaging. The fix: a “hot path” for critical streams processed in real-time and a “warm path” for lower-priority data in micro-batches.
Skipping edge processing. Every project starts assuming bandwidth is unlimited. By month three, the cloud bill is 4x the estimate, and the time-series database is drowning in redundant steady-state data.
Ignoring legacy equipment. The newest machines speak OPC UA natively. The oldest, often the most failure-prone, speak Modbus or provide only analog signals that require DAQ hardware. A pipeline covering only modern equipment misses the machines most in need of monitoring. Budget for retrofit sensors, DAQ modules, and protocol adapters.
Assuming internet connectivity everywhere. In steel mills, underground mining operations, food processing cold rooms, and remote plants in rural India or northern Scandinavia, the factory floor may have no internet access at all. Designing a pipeline that requires constant cloud connectivity is a design failure. Every stage must work locally and sync when possible.
Lessons from Building Insight Extraction Pipelines for Industrial Data
We have built pipelines for industrial data projects handling noisy operational telemetry and production workforce data. Three lessons apply directly to manufacturing.
Clean before you compute. Raw industrial sensor feeds include gaps from shift changes, spikes from recalibration events, and drift from sensor degradation. A three-stage cleaning pipeline (gap interpolation, spike removal via modified Z-score, drift correction against calibration baselines) is a prerequisite before any OEE calculation or anomaly detection will produce trustworthy results.
Build a shared reference data layer. MES, ERP, SCADA, and quality systems all reference the same equipment with different identifiers. A single mapping table across systems prevents the point-to-point translation logic that breaks every time a system updates.
Store granular, aggregate late. Plant-level OEE on a daily summary helps management reporting. It cannot diagnose why Line 3 dropped during Night Shift on Tuesday. Keep machine-level, per-minute data. Aggregate in the dashboard, not the pipeline.
Build Your Real-Time Data Pipeline for Manufacturing with DigiWagon
DigiWagon’s data engineering and ETL services cover the full manufacturing data pipeline, from sensor ingestion through edge processing to operational BI dashboards for plant teams.
What we bring to manufacturing software development data infrastructure:
- Protocol integration across OPC UA, MQTT, Modbus, and DAQ hardware for both modern and legacy equipment
- Edge pre-processing architecture that works in connected, limited-connectivity, and fully air-gapped environments
- Time-series data pipeline design with contextual enrichment from MES and ERP systems
- Role-based dashboard delivery for shift supervisors, maintenance teams, and plant managers
Conclusion
Collecting sensor data is the easy part. The hard part is the four-stage architecture that turns it into decisions: protocol-aware ingestion, edge filtering that cuts noise before it reaches your servers, a transformation layer that adds production context, and dashboards built for the people on the factory floor. Start with your sensor inventory, deploy edge processing early, build a shared reference data layer, store granular, and monitor the pipeline itself. The technology stack is mature. Disciplined architecture is what makes it work at production scale.
Related reading: architecting a computer vision inspection pipeline, the manufacturing digital transformation roadmap and building the modern data stack. If the pipeline is meant to feed machine learning models, the free AI Readiness Assessment shows whether the data foundation is ready for them.