Instrumenting Production AI: Key Takeaways
- In production AI, the feature pipeline breaks far more often than the model, and it breaks silently.
- Accuracy monitoring is unavailable when ground-truth labels arrive weeks after the prediction is served.
- Input-distribution drift is the earliest signal you can compute at serving time, per feature, with no labels.
- Feature freshness is the alert that should page an engineer; model score drift is a lagging symptom.
- An LLM gateway instruments language-model calls, but classical ML services still need pipeline telemetry of their own.
AI observability is the instrumentation that shows whether a production AI system is receiving the inputs it was built for and serving predictions from current data. It covers input-distribution drift, feature freshness, serving latency, and prediction output. The deliverable is a telemetry layer that detects pipeline degradation before any ground-truth label exists.
Why Model Dashboards Miss Most Production Failures
Google's "Hidden Technical Debt in Machine Learning Systems" (Sculley et al., NeurIPS 2015) made the point that has held up for a decade: in a real-world ML system, the model code is a small fraction of the whole. The rest is data collection, feature extraction, configuration, serving infrastructure, and monitoring. That surrounding machinery is where most failures start.
Google's own production-readiness rubric, the ML Test Score (Breck et al., IEEE Big Data 2017), lists 28 tests. Seven are about monitoring, and four of those seven check dependencies, data invariants, training-serving skew, or staleness rather than prediction quality.
This article covers observability for AI workloads that are not LLM applications: classical ML services, streaming inference, and the feature pipelines that feed them. It is one layer of a wider enterprise AI architecture blueprint, and it argues for instrumenting the pipeline first.
Why Is Model Accuracy the Wrong Signal When Labels Arrive Late?
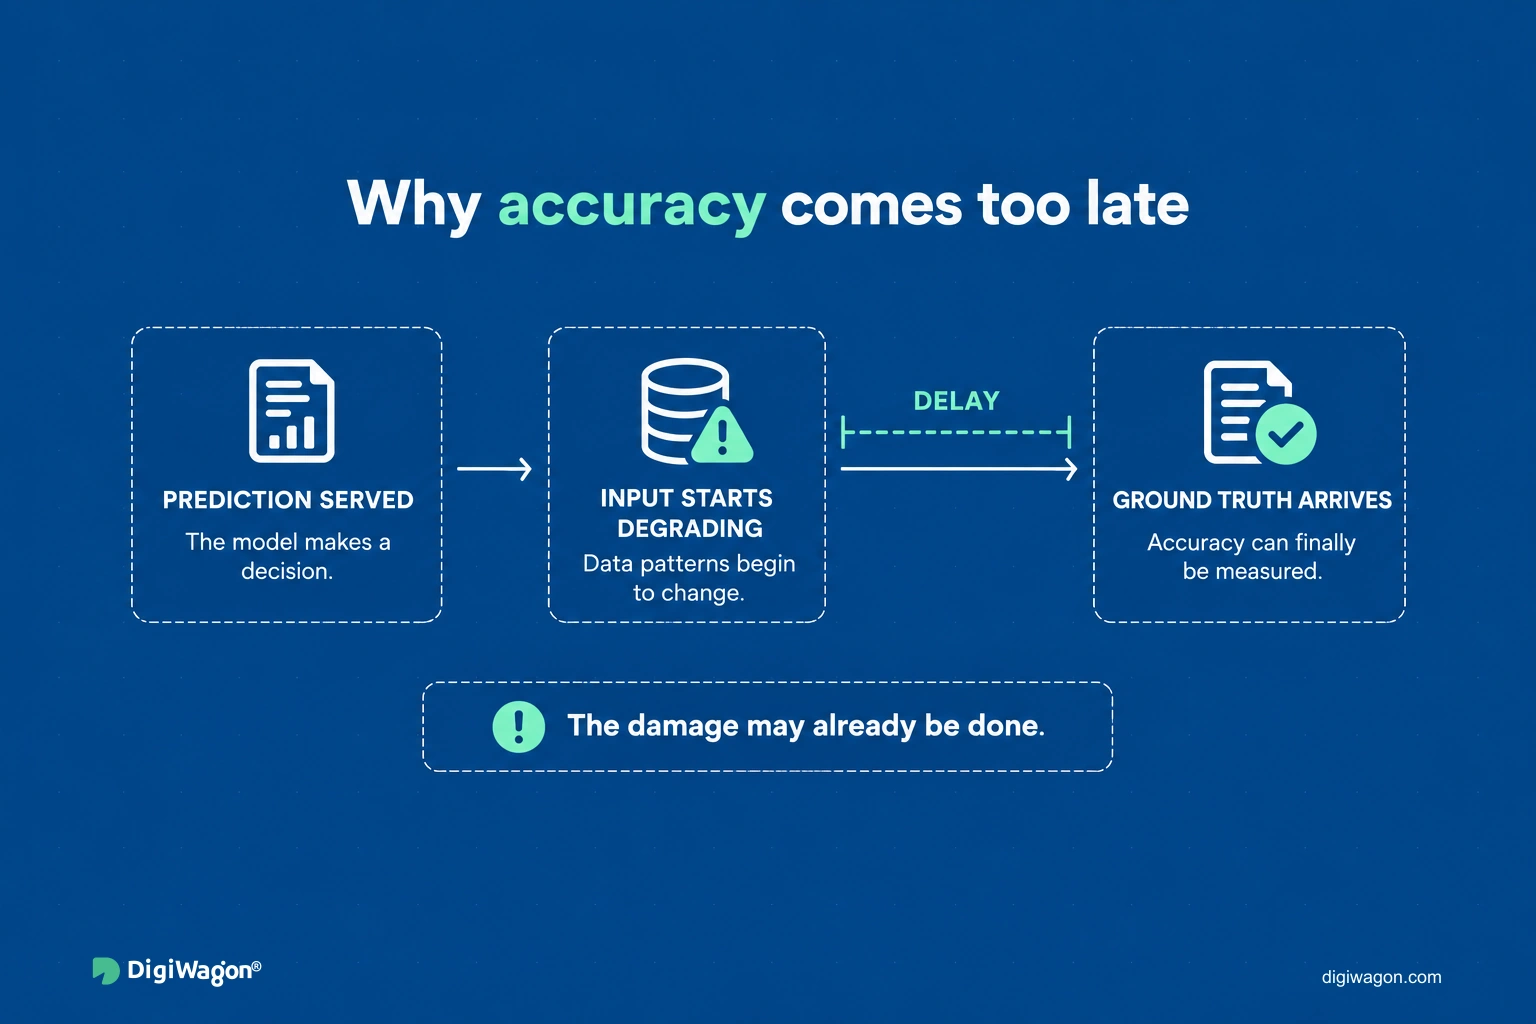
Accuracy needs a label. In most commercial ML systems, the label arrives long after the prediction.
- Transaction monitoring: a flagged payment becomes "true positive" only when an investigation closes.
- Predictive maintenance: a failure prediction is confirmed only when the component fails, or a technician inspects it.
- Credit and churn models: the outcome lands months after the score.
By the time accuracy is computable, the system has already served every prediction made on degraded inputs. A model scored against stale features can return confident, well-formed predictions with zero errors on every request.
| Signal | Available at | Needs labels | Catches | Misses |
|---|---|---|---|---|
| Accuracy, AUC, precision | After labels land | Yes | Real model decay, concept drift | Everything before labels arrive |
| Model score distribution | Serving time | No | Large output shifts | Pipeline faults that keep scores plausible |
| Input-distribution drift | Serving time | No | Upstream source, unit, or population changes | Concept drift on stable inputs |
| Feature freshness | Ingestion time | No | Stalled jobs, late partitions, stuck sensors | Fresh data that has shifted |
| Serving SLIs (latency, errors) | Request time | No | Infrastructure faults | Silent data faults |
Read the table top to bottom and the ordering is clear. The two signals that need no labels and fire earliest both sit in the pipeline, not in the model.
How Do You Detect Input Drift Before Accuracy Drops?
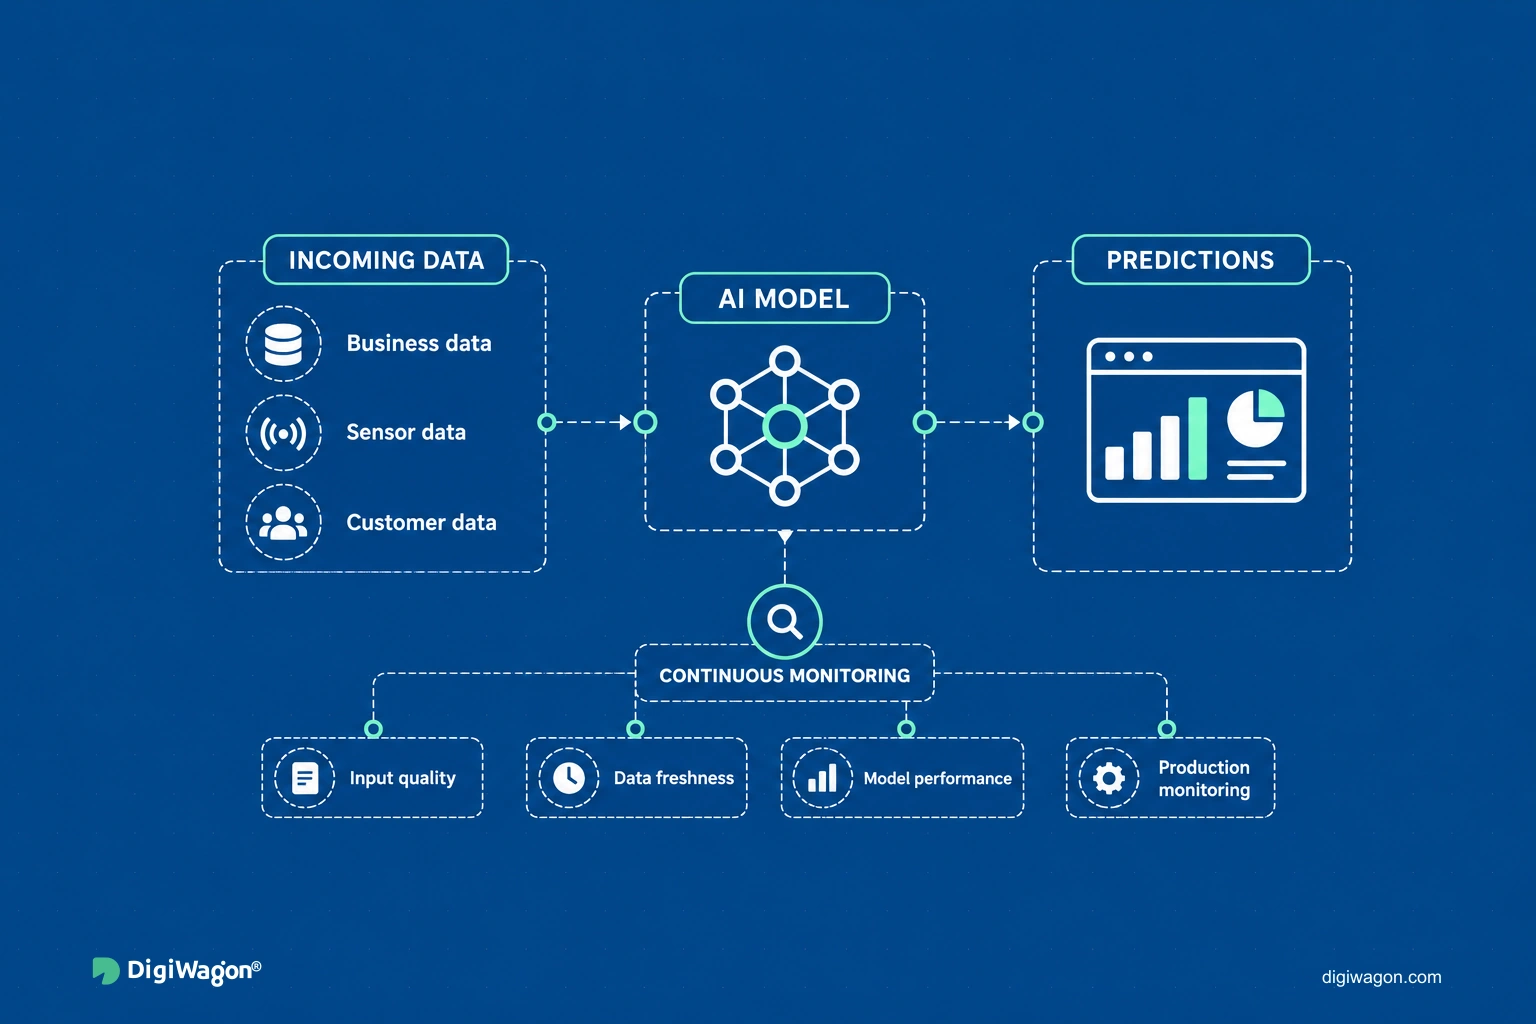
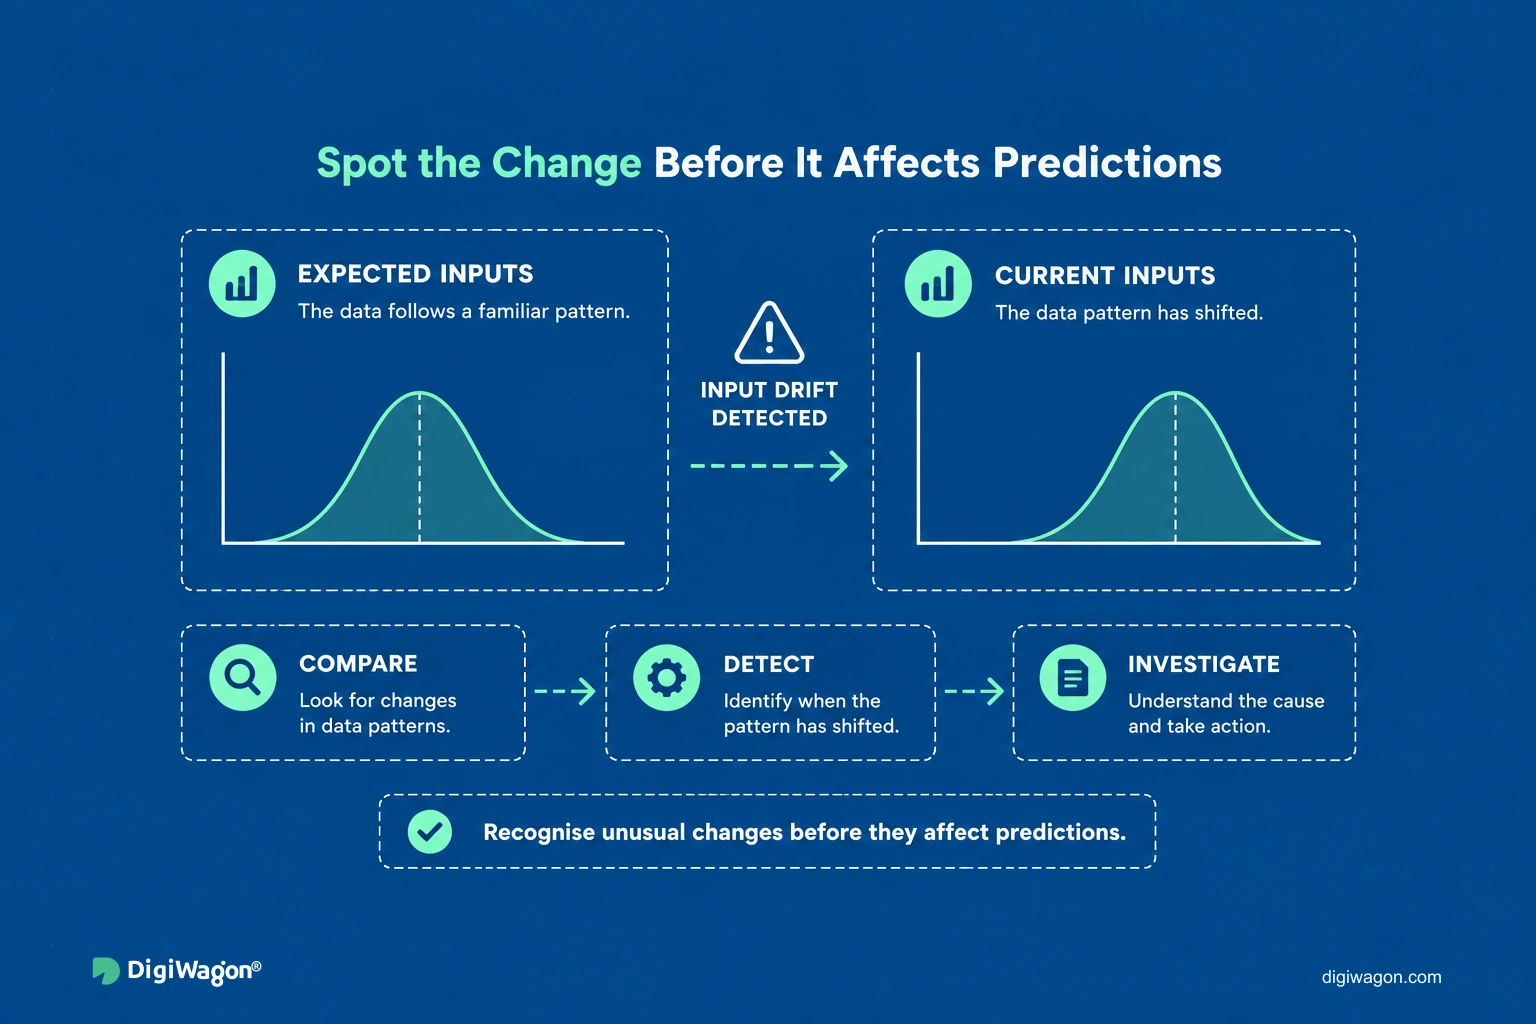
Drift detection on inputs needs no labels, so it is the earliest model-quality signal a production system can compute. The ML Test Score frames the underlying requirement directly: data invariants that held in training must hold in serving inputs.
Baseline per feature, not per model
Store a reference distribution for each feature from the training or validation window, versioned with the model. Compare each serving window against that reference. A single model-level drift score hides which feature moved, and that is the first question an on-call engineer asks.
Match the statistic to the feature type
- Binned numeric and categorical features: Population Stability Index (PSI) over fixed bins.
- Continuous features: a two-sample Kolmogorov-Smirnov test, with a sample size cap so large windows do not flag trivial shifts.
- Categorical features: null rate, cardinality, and share of unseen categories.
- Sensor features: physical range checks, because a unit change produces values no statistical test needs to explain.
Page on contract breaks, trend on gradual shift
A schema change, a unit change, or a feature that goes to 100% nulls is a contract break and should page. A slow population shift belongs on a dashboard with a scheduled review. In manufacturing software development, a recalibrated sensor or a firmware update on part of a fleet can shift a feature's distribution overnight while the schema stays identical.
Teams evaluating this pattern for their own estate can see how AI and machine learning engineering services cover drift baselines, feature pipelines, and serving telemetry as one system.
What Does Feature Freshness Alerting Look Like in an AI Observability Stack?
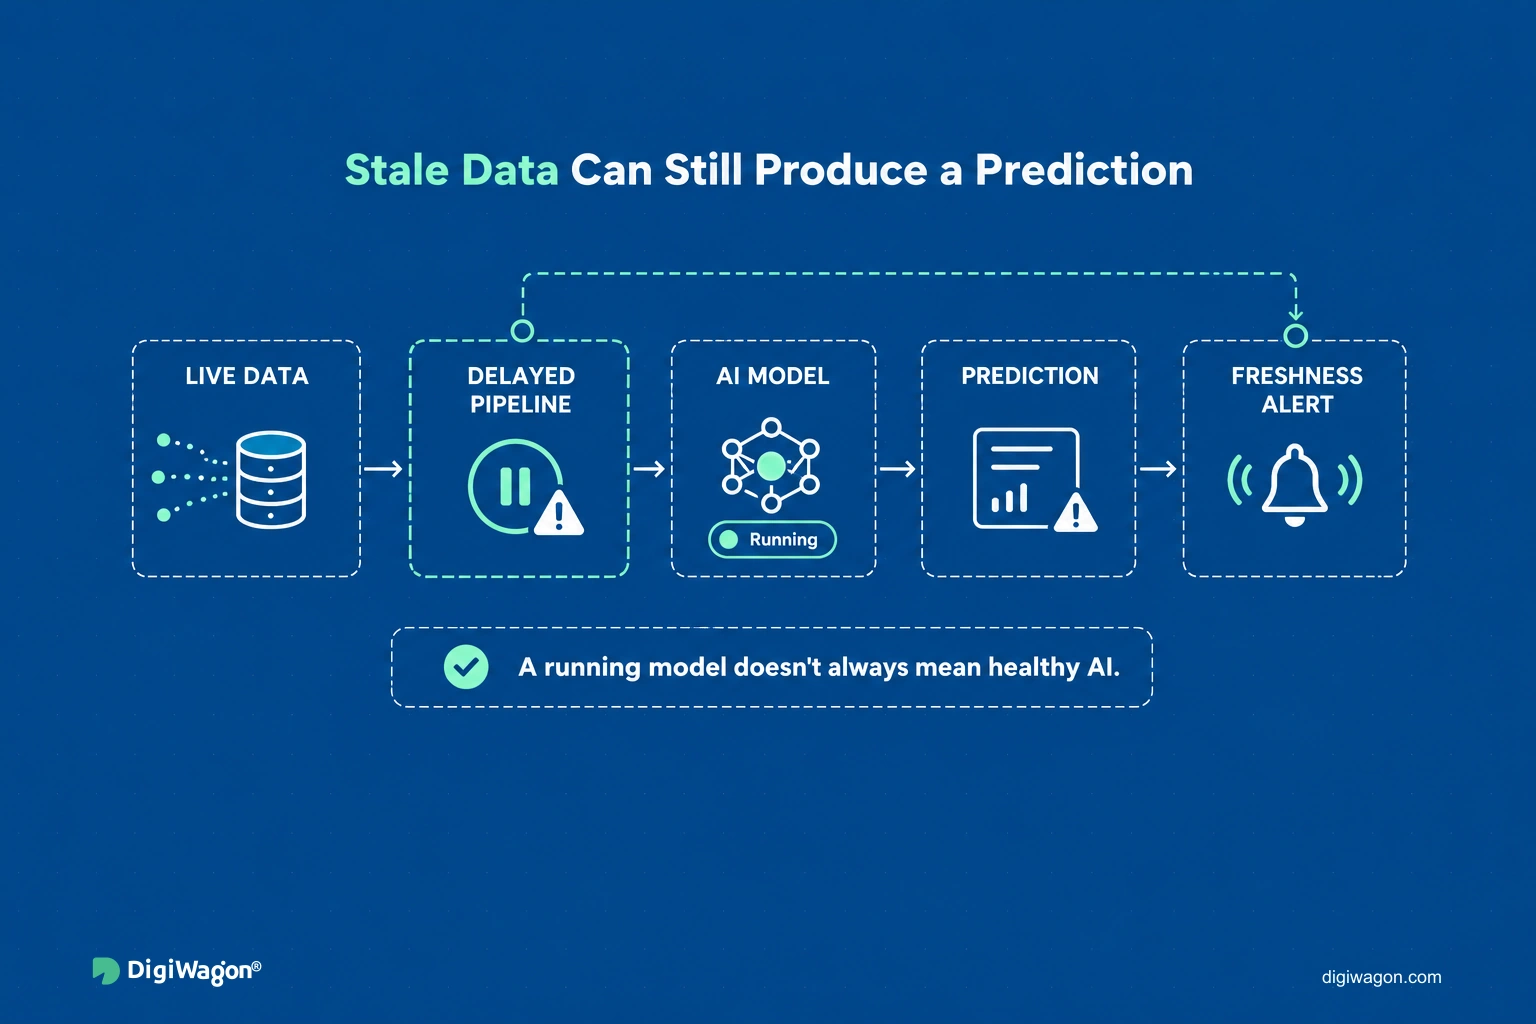
Feature freshness is the age of the newest value used at inference time, measured per feature. It is the failure that pages someone, because it is the one with a clear owner and a clear fix.
The Google SRE book (Chapter 6, "Monitoring Distributed Systems") sets the bar for paging: every page should be urgent and actionable. A freshness alert meets that bar because it names the stalled job. A model score alert rarely does, because the score is downstream of a dozen possible causes.
What the pipeline should emit
- Event timestamp of the newest record behind each feature, stamped at ingestion
- Last successful run time for every feature job
- Row count per window against the expected count
- Share of predictions served with a defaulted or imputed feature value
The last metric is the one teams most often skip. When a feature store lookup fails and the serving layer falls back to a default, the model still answers, and nothing upstream records that the answer was built on a placeholder.
Freshness budgets per feature group
Set the freshness budget from how fast the underlying signal changes, not from the batch schedule. Edge and ingestion stages in a sensor-to-dashboard pipeline design are where these timestamps should be stamped. Systems that fuse vision, voice, and sensor streams, as in multimodal decision intelligence for Industry 4.0, need a budget per modality, because one stalled stream can bias a fused prediction while every other stream looks healthy.
Where Does an LLM Gateway Fit Alongside Classical ML Telemetry?
An LLM gateway is a proxy between applications and language-model providers. It centralises routing, rate limits, key management, token accounting, and request logging for every LLM call.
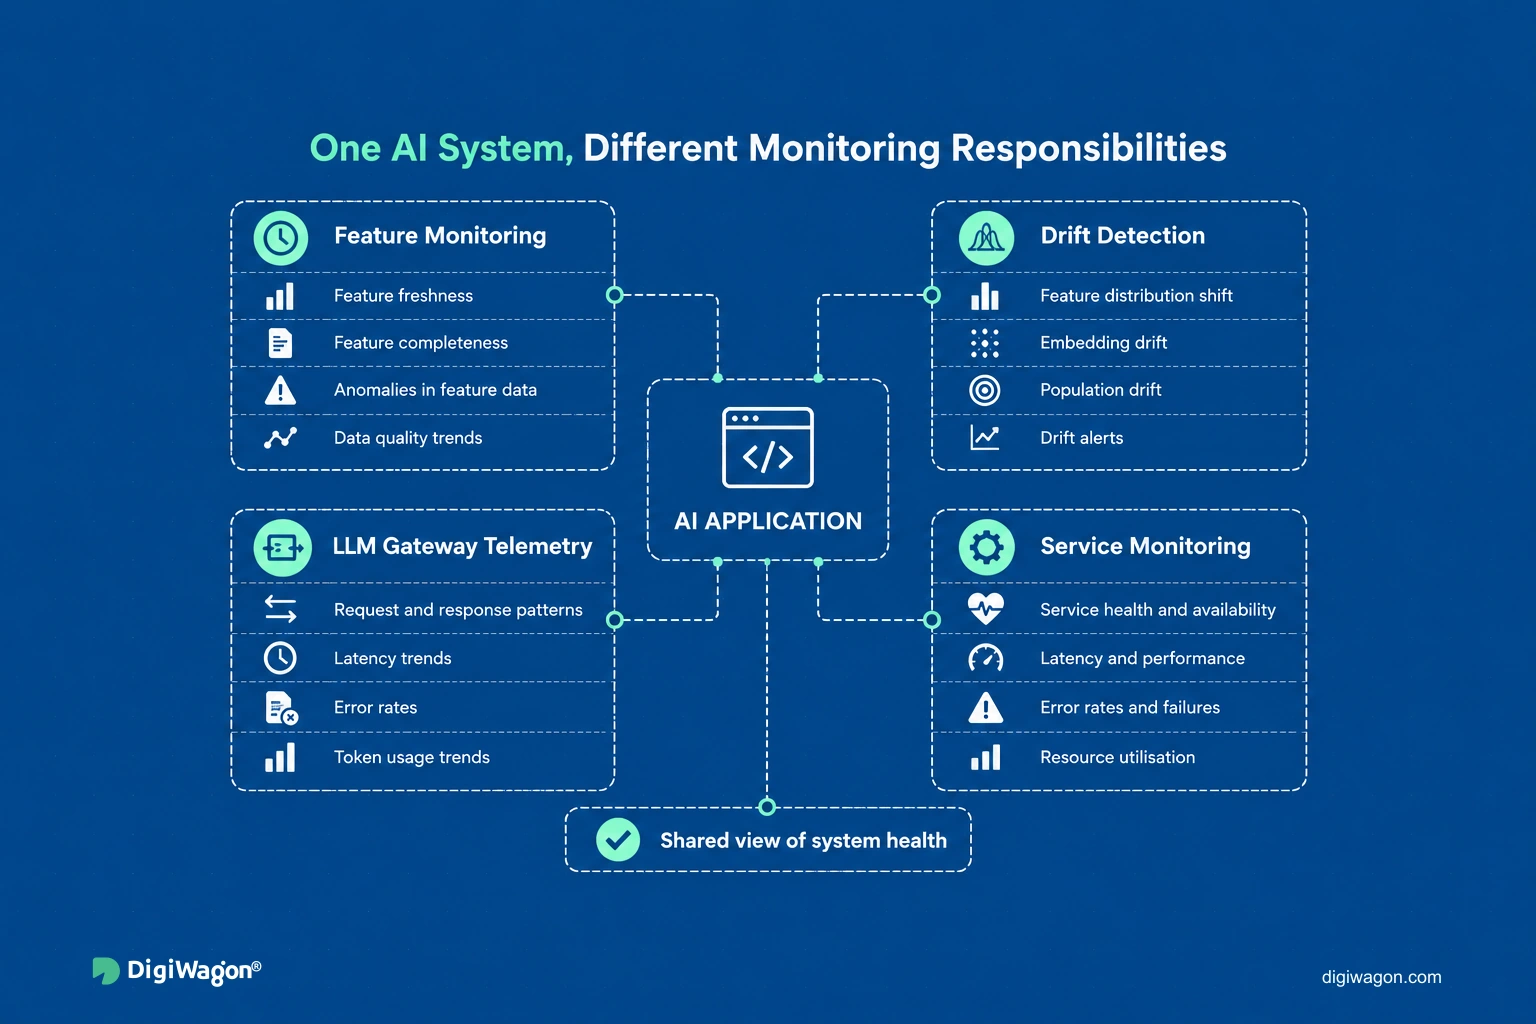
When an AI estate mixes LLM calls with classical models, the gateway is the natural instrumentation point for the LLM traffic. It cannot see the feature pipeline feeding a fraud model or a remaining-useful-life model. Those services still need the drift and freshness telemetry described above.
The architectural link between the two is shared trace context. OpenTelemetry, the CNCF observability standard, lets a single request that touches a feature store, a classical model, and an LLM behind the gateway produce one trace. LLM-specific telemetry such as prompt capture and evaluation scoring is a separate design problem, covered in our LLM observability architecture guide, and sits outside this article.
| Component | Instruments | Blind to |
|---|---|---|
| LLM gateway | LLM requests, tokens, provider latency, errors | Feature pipelines, classical model inputs |
| Feature pipeline telemetry | Freshness, row counts, defaulted values | Model outputs |
| Drift monitor | Input distributions against a versioned baseline | Labels, infrastructure faults |
| APM and serving SLIs | Latency, errors, saturation | Data quality |
What Does the Observability Layer Owe the Governance Layer?
NIST's AI Risk Management Framework (AI RMF 1.0, 2023) asks, under MEASURE 2.4, that an AI system's functionality and behavior be monitored in production. When a firm's risk policy requires evidence that a model ran on valid inputs, the architectural response is to retain drift and freshness metrics as versioned, queryable records rather than dashboard pixels.
- Per-prediction lineage: model version, feature-set version, and feature freshness at inference time, written with the prediction.
- Drift report retention: each report stored against the baseline version it was computed from.
- Alert history: every page, acknowledgement, and resolution kept in the same store.
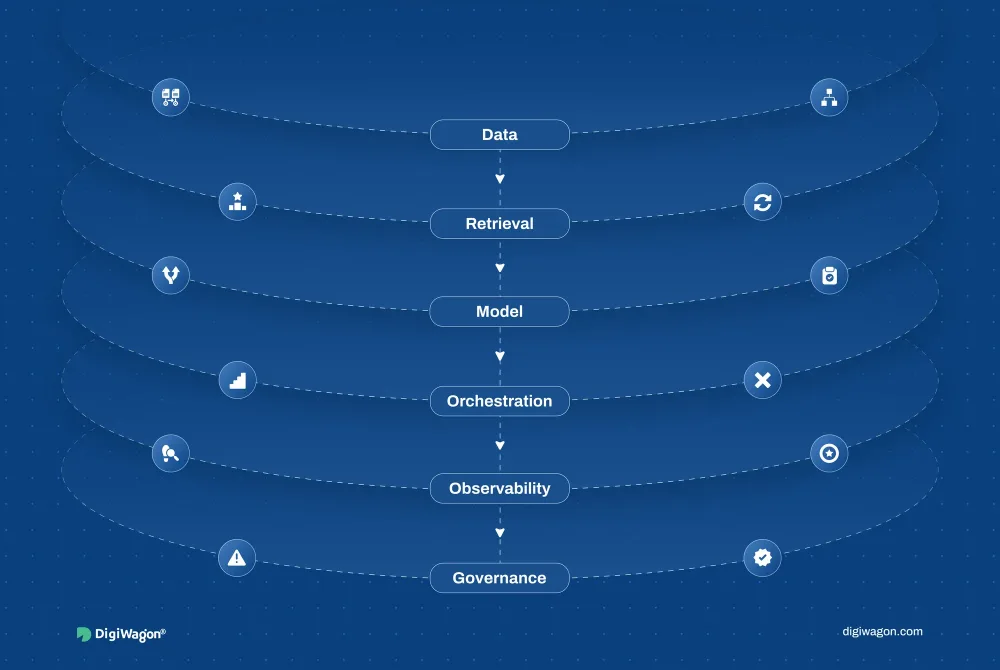
This turns the telemetry layer into the system of record that the governance and compliance layer of a production AI reference architecture reads from. The functional team owns the policy; the pipeline owns the evidence.
Lessons from Monitoring Transaction and Sensor Models
Two DigiWagon builds shaped this pattern. On the Transaction Intelligence & Behavioral Analytics platform, a Node.js and PostgreSQL stack on AWS scored transactions in real time against behavioural baselines. Investigation outcomes, the only true labels, closed weeks after each alert. We chose input-distribution drift over output-accuracy monitoring because accuracy was unavailable for the window in which a bad input could do damage.
The second build was a predictive maintenance platform for a tractor OEM, mixing 3-sensor retrofit units on legacy tractors with 10-sensor ECU data on modern ones. Inference ran locally at service stations with periodic central sync. The model was rarely what broke. The sensor feed was.
Instrumenting Your ML Pipelines with DigiWagon
DigiWagon builds the telemetry layer production ML systems need beyond model dashboards, covering:
- Per-feature drift baselines versioned with each model
- Freshness timestamps and defaulted-value tracking in feature pipelines
- OpenTelemetry tracing across feature stores, models, and LLM gateways
- Retained, queryable monitoring records for model governance
Monitoring the System the Model Depends On
Production AI degrades through its pipeline far more often than through its model, and pipeline failures are silent by default. Accuracy arrives too late to act on, so the earliest usable signals are input drift and feature freshness. Instrument those per feature, version the baselines with the model, and keep the records queryable. An AI system without pipeline telemetry is unmonitored, however many model dashboards it has. Pipelines instrumented this way page the right engineer before a stale feature reaches a decision.