Pipelines You Can Trust: Key Takeaways
- The failure that costs money is the job that succeeded on stale or partial input.
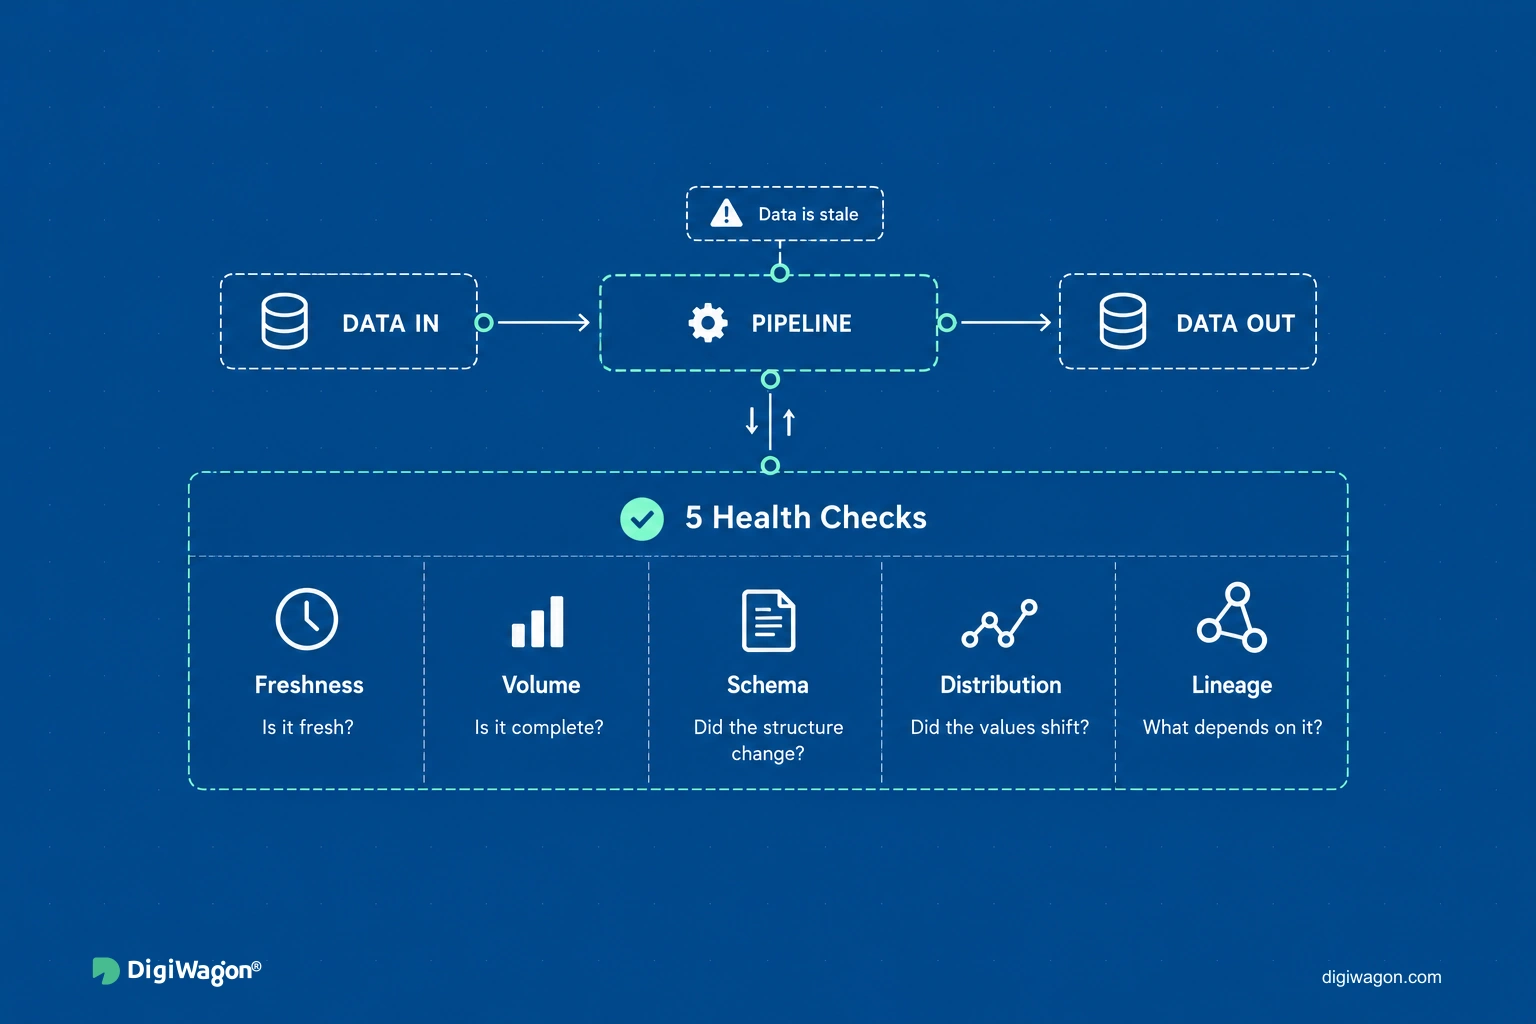
- Five signals cover a pipeline's health: freshness, volume, schema, distribution, and lineage.
- Capture each signal at the consumer boundary, not at the job's exit code.
- An alert nobody acts on is worse than no alert at all.
- Lineage converts an alert into a blast radius and a named downstream owner.
What Is Data Observability in a Data Pipeline?
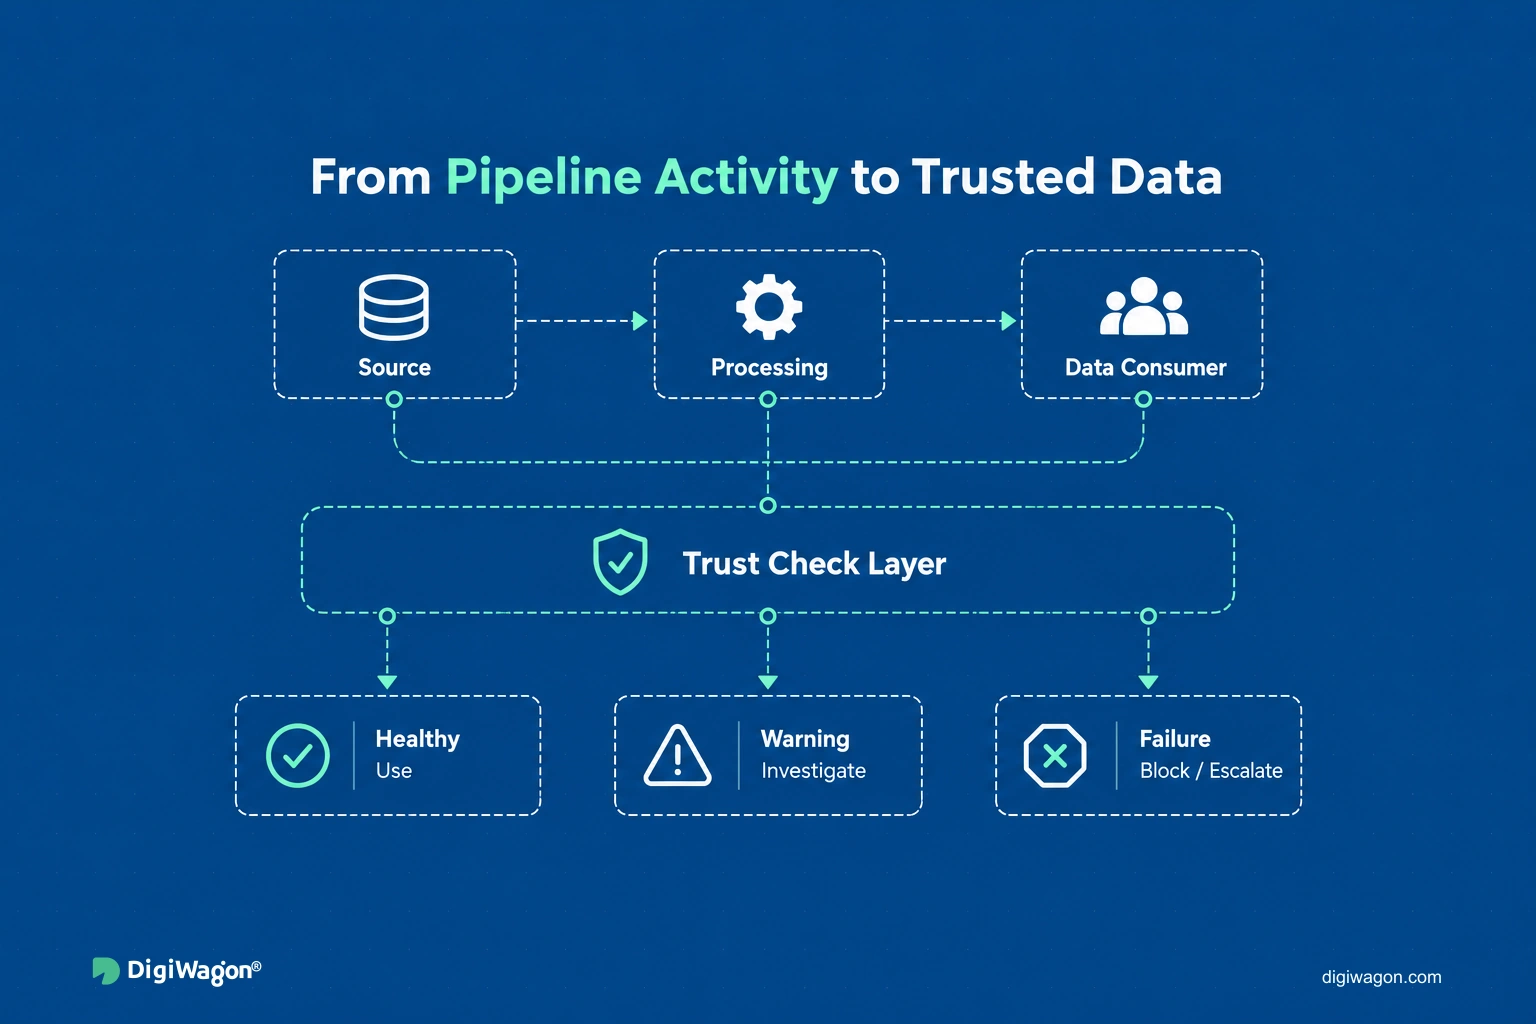
Data observability is the instrumentation layer that reports whether a pipeline's output is fit to use, not merely whether its jobs ran. It captures freshness, volume, schema, distribution, and lineage as measured signals. The output is a pipeline that can prove what was true at the moment any downstream read happened.
Data observability and AI observability are not the same layer
The two share vocabulary and instrument different things. AI observability watches model behaviour: prompt and response traces, token cost, output drift, evaluation scores against a golden set. Data observability watches data movement: whether the rows arrived, on time, in the expected shape, with values inside the expected envelope.
A model can be perfectly instrumented and still answer from a table that stopped updating four days ago. Instrument both. This piece covers the data layer, which sits inside the modern data stack these pipelines run on.
Why a Job That Succeeded Is the Dangerous One
A crashed job pages someone. A job that succeeded on stale input does not, and its output reaches a dashboard, a pricing rule, or a feature store with no warning attached.
The Gartner Market Guide for Data Observability Tools (Gartner, 2024) names the structural reason: static, event-based monitoring cannot give a holistic view of modern data architectures, because those architectures are too complex and dynamic for it. Orchestrators report task status. They do not report whether the rows that arrived were the rows expected.
The consumer has changed too. Pipeline output now feeds retrieval layers and feature stores, so a quiet regression propagates into a system that answers with confidence rather than into a chart a human might squint at.
That is the gap an observability layer fills. The measurement surface is the data itself, not the process that moved it.
What Are the Five Signals Worth Instrumenting?
Each signal catches a class of failure the others are blind to, which is the argument for instrumenting all five rather than the two that are easiest to wire up.
| Signal | What it catches | Where it is captured | What it misses |
|---|---|---|---|
| Freshness | Stale partitions, late or skipped loads | Consumer read boundary, as event-time lag | On-time data that is wrong |
| Volume | Truncated extracts, duplicate or dropped rows | Post-load row counts against a rolling baseline | Right row count, corrupted values |
| Schema | Added, dropped, or retyped columns upstream | Ingress, against a registered contract | Semantic change inside an unchanged column |
| Distribution | Null-rate spikes, range shifts, category drift | Post-transform, per column, against a baseline window | First loads with no baseline |
| Lineage | Which downstream assets a defect reaches | Orchestration metadata plus query parsing | Correctness, on its own |
ISO/IEC 25012:2008 defines 15 data quality characteristics for structured data, reconfirmed as current in ISO's 2025 systematic review. The five signals are the runtime measurement of those characteristics: freshness measures currentness, volume and distribution measure completeness and consistency, lineage measures traceability.
Teams retrofitting these signals onto an existing stack can see how data engineering and pipeline design services cover ingestion through instrumentation.
Where in the Pipeline Does Each Signal Have to Be Captured?
Capture point decides whether a signal is an alert or an incident report. A freshness check that runs after the morning dashboard refresh tells you why the number was wrong. It does not stop the number being wrong.
Three placement rules hold across stacks.
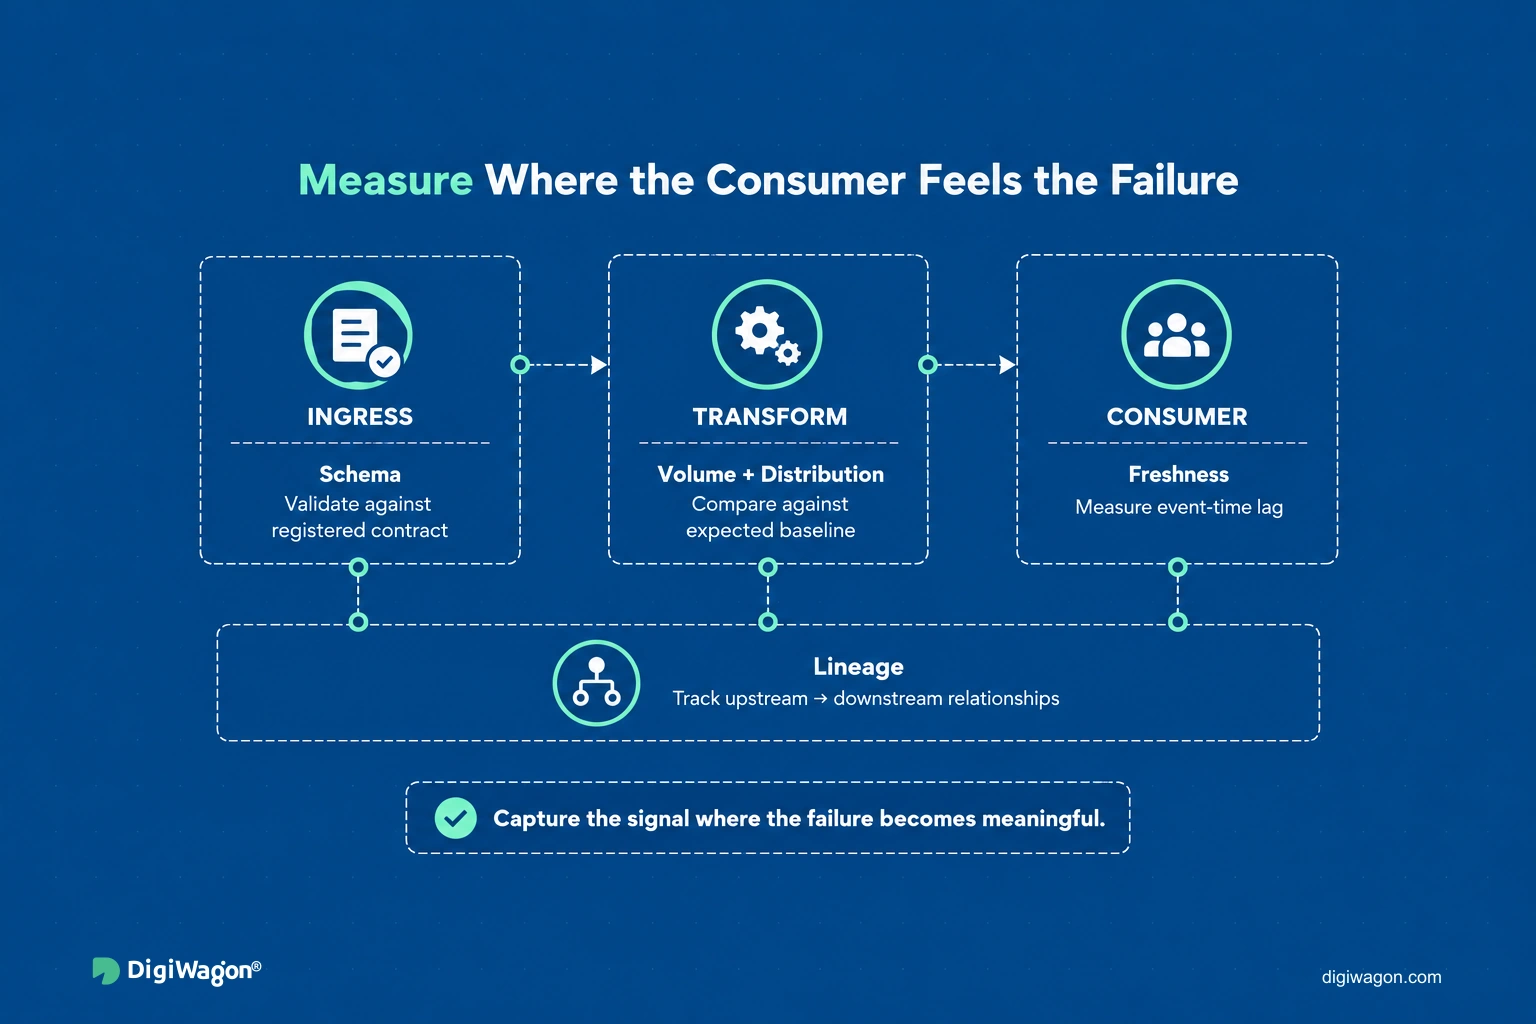
- Schema at ingress, against a contract. When a producing team can change a column without coordinating, the architectural response is a registered schema contract at the write path, so the producer's change fails the load instead of the report.
- Freshness at the consumer boundary, as event-time lag. Job completion is the orchestrator's view. Event-time lag is the consumer's view, and the two diverge exactly when a partition falls behind while the task still exits zero.
- Volume and distribution post-transform, per column. Aggregate row counts survive a column going 90% null. Per-column statistics do not.
Telemetry shape matters as much as placement. OpenTelemetry semantic conventions standardise attribute names, span names, and metric instruments, which is what lets a pipeline's signals be correlated across the orchestrator, the warehouse, and the transport between them. Emitting signals as arbitrary application logs costs you that correlation later.
Streaming changes the placement, not the principle: freshness becomes consumer lag on the topic partition and volume becomes a windowed rate, a pattern visible in streaming ingestion architectures for sensor data.
How Do You Set Thresholds an On-Call Rota Survives?
Most observability projects fail here, not at instrumentation. Wiring up signals is a sprint. Deciding what deserves a page at 2am is the hard part, and getting it wrong trains the rota to mute the channel.
Google's SRE guidance on service level objectives is direct: choosing too many indicators makes it hard to pay the right level of attention to the ones that matter, and the recommendation is to keep as few objectives as possible. Not every table gets an SLO. The tables with a consumer who has a deadline get one.
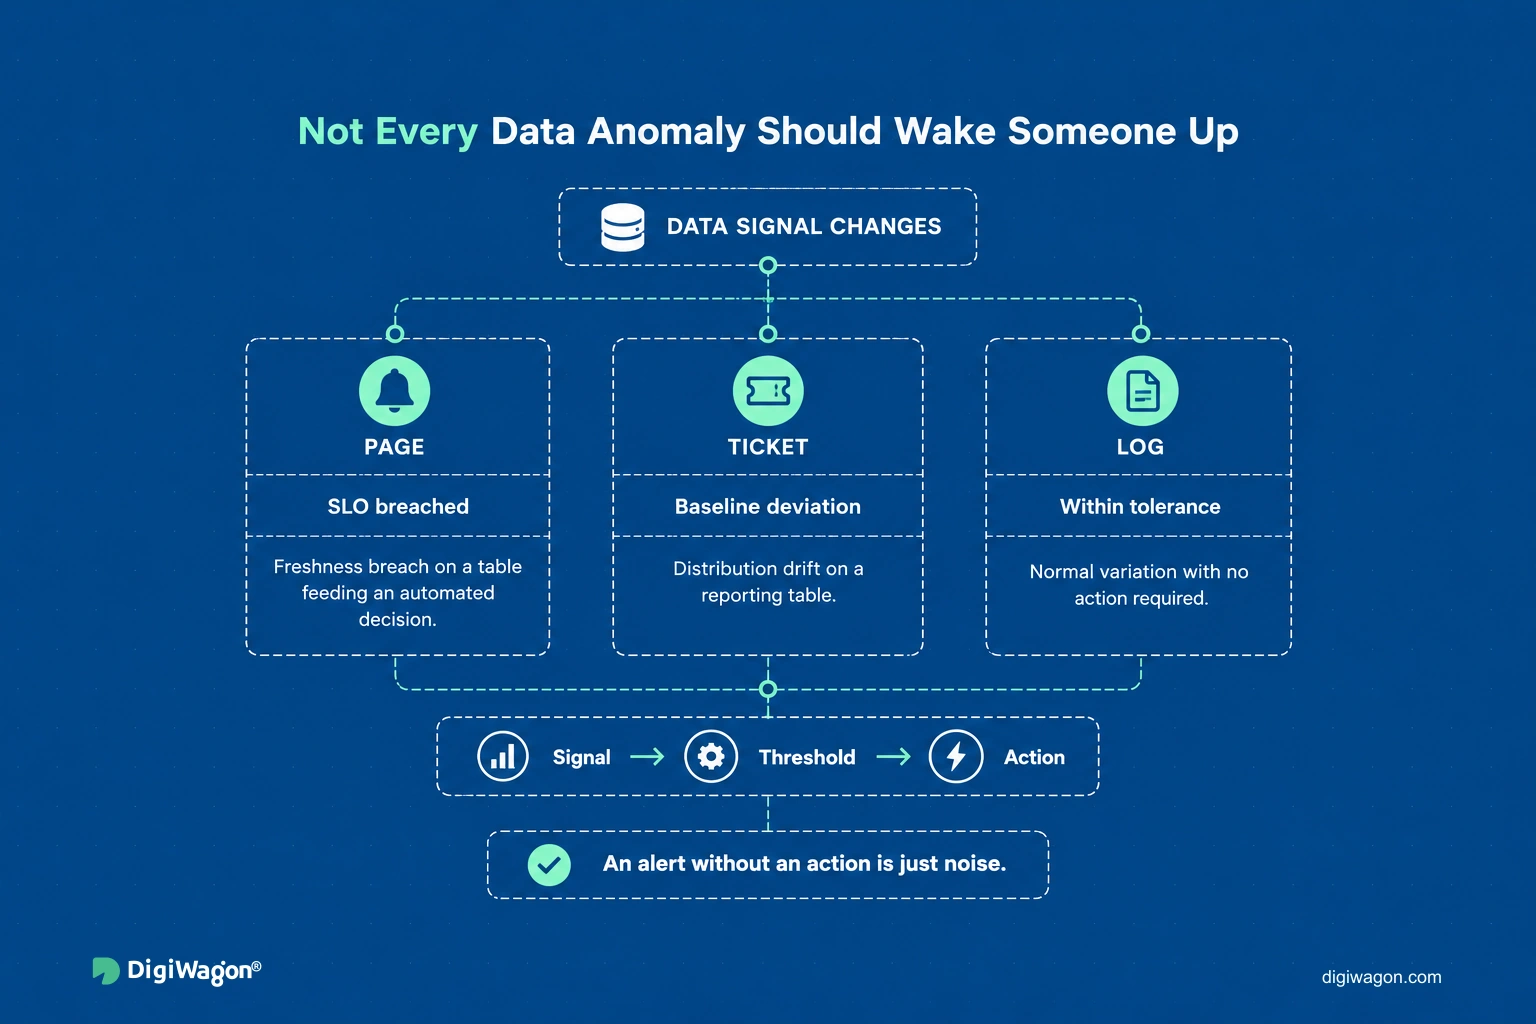
A workable threshold model has three tiers:
- Page: the asset has a stated SLO and the signal breached it. Freshness on a table feeding an automated decision sits here.
- Ticket: the signal deviated from baseline, but no SLO exists or none was breached. Distribution drift on a reporting table sits here.
- Log only: the signal moved inside tolerance. Useful for the next investigation, useless as an interrupt.
Error budgets carry over cleanly. When the business accepts that a table can be late some of the time, the architectural expression is a freshness budget consumed over a rolling window, with alerting driven by burn rate rather than by a single breach. Static thresholds on seasonal data give you the opposite: a quiet channel in December, a noisy one in January.
Lineage Is What Turns an Alert Into a Decision
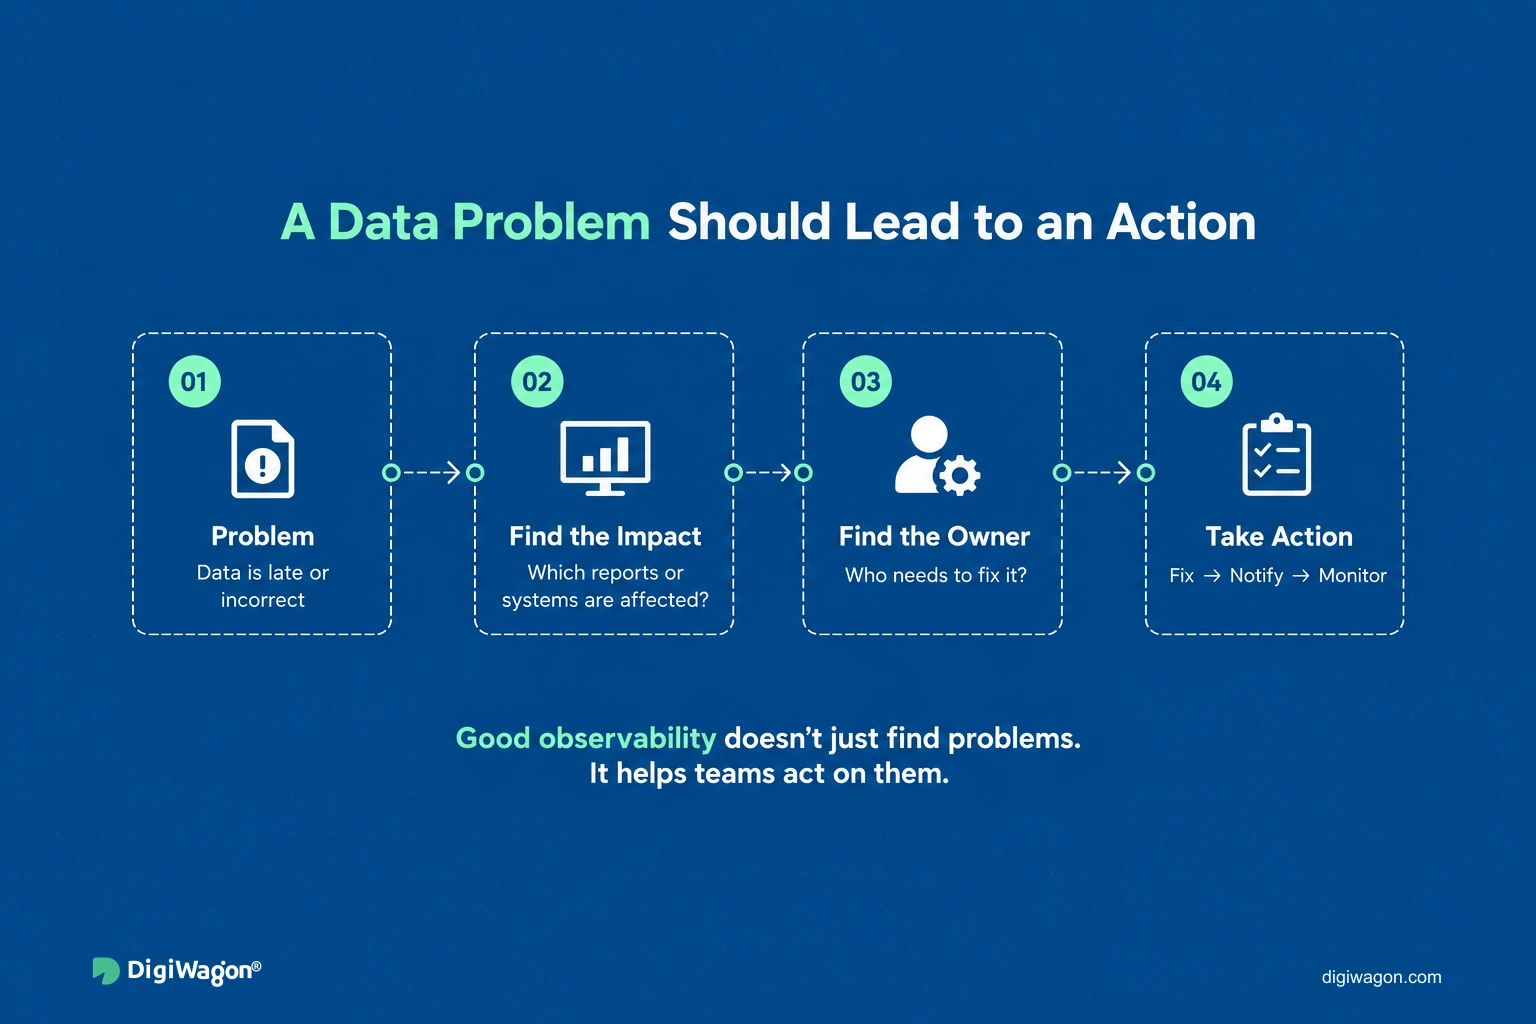
A freshness alert on a staging table tells an engineer something broke. It does not say who to tell. Lineage answers that, and it is the difference between a signal and a response.
DAMA's Data Management Body of Knowledge treats lineage as a metadata management function rather than a monitoring feature, and that framing is the useful one architecturally. Lineage is a graph built from orchestration dependencies and parsed query plans, maintained as a first-class asset and queried at alert time to resolve blast radius: which marts, dashboards, feature tables, and exports read from the broken node.
Column-level lineage earns its extra parsing cost when the pipeline carries derived fields, because a defect in one source column rarely invalidates the whole table. Table-level lineage over-escalates: it tells six teams to stand down when one of them was affected.
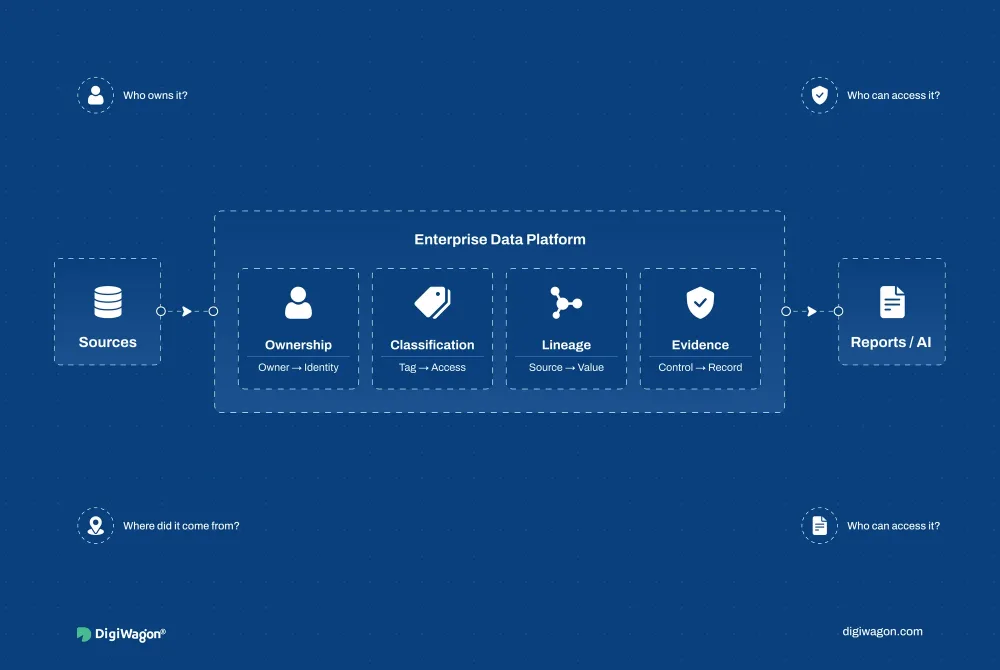
The same graph pays off on the way in. Versioned inputs plus lineage let you reconstruct what a downstream system read on a given day, the property that makes a pipeline reproducible rather than merely correct today. Who owns each node, and how that reconstruction is evidenced for an auditor, is the data governance half of the same design.
Lessons from Instrumenting Sub-Second Screening Pipelines
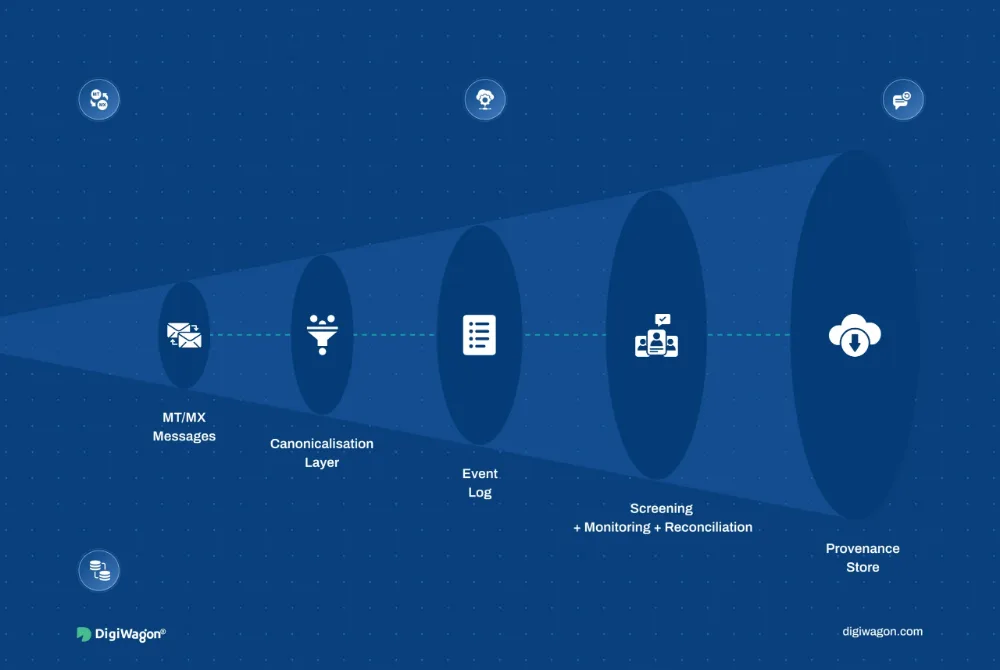
We built the real-time payment screening platform against a hard latency budget, and that constraint forced the instrumentation question early. A pipeline with no SLA can absorb a late file. One that screens a payment in flight cannot.
Three decisions carried over into the SWIFT Data Orchestration work and the Transaction Intelligence and Behavioral Analytics platform that consumed its output:
- Freshness was measured as consumer lag on the Kafka partition, not as task completion in Airflow, because the task finishes on time while a partition sits behind.
- Signal history landed in PostgreSQL with TimescaleDB, chosen over Prometheus because the queries we actually ran were historical and relational, asking what a table looked like on the day of a past alert. Prometheus retention limits and label cardinality fought both.
- Schema checks ran at ingress against a registered contract, so a producer change failed the write rather than the downstream report.
The pattern that transferred: the analytical consumer inherits every silent defect upstream, so the signal belongs where the consumer reads.
Building an Observability Layer with DigiWagon
DigiWagon builds instrumentation into the pipeline rather than bolting a monitor onto a finished stack, inside wider analytics and data platform engagements. Typical scope:
- Signal design and SLO definition per asset, tied to the consumer's deadline
- Schema contracts and ingress validation at producer boundaries
- Column-level lineage graphs wired into alert routing
- Burn-rate alerting that survives seasonality
Making the Trust Call on Your Pipeline
Trust in a pipeline is a property you can evidence: it states how fresh its output is, proves the shape of what it loaded, and names every asset a defect reaches. Instrument the five signals, capture them where the consumer reads rather than where the job exits, and let SLOs decide which breaches are worth waking someone for. Get those three calls right and the argument shifts from whether the number is correct to what it means. What you will have built is a pipeline that can prove its freshness, not one that merely reports that it ran.