Skip to content
/
Business Intelligence (BI) & Data Visualization Services

Business Intelligence (BI) & Data Visualisation services

Data You Can See. Intelligence You Can Feel.

How Our BI Engagements Work?

DigiWagon builds production-grade Business Intelligence and data visualisation platforms on Power BI, Tableau, and Looker connecting your data warehouse to self-service dashboards used by operating teams in FinTech, RegTech, and manufacturing.

According to the McKinsey report, data-driven companies are 23x more likely to acquire customers and 19x more likely to be profitable. While choosing the right partner, businesses should go through various checking factors such as experience in the industry, advanced technology, security, expandability, and much more.

DigiWagon fits right here. With 10+ years of experience in the industry and a proven portfolio, we deliver decision ecosystems. Our team has expertise in advanced technology, building custom BI architectures, intuitive design, and combining AI modelling and visualisation for end-to-end intelligence. This page will walk you through all the information that you need to have before choosing us as your next partner.

The Anatomy of Our Business Intelligence (BI) & Data Visualisation Services

Insight-Driven Data Visualisation

BI does not need to look like a lab report. Through thoughtful data visualisation, we wrap reason in breathing beauty, you sense where you are heading and the future starts showing up on your dashboard.  Numbers appear where the eye expects them, relationships between metrics are clear at a glance, and patterns reveal themselves without forcing users to dig through charts or mentally stitch insights together. The layout does part of the thinking for you. In short, the layout does the part of thinking of you. So, when visual design is treated as part of the intelligence itself, adoption improves naturally. Teams engage with dashboards because they understand them and can move from insight to action.

Context-Rich BI Analysis

It's easy to know what's in plain sight but what makes us apart in effective business intelligence is that we dig where patterns hide. Depth, not data, is about uncovering the patterns that don’t announce themselves immediately. As layers of information are explored, relationships begin to surface, signals become clearer, and context forms naturally around what initially looked like isolated numbers. This deeper view helps explain not just what changed, but how and why it did. When BI is built this way, layer by layer it will reveal more meaning and guide decisions that feel inborn. 

Unified BI & Reporting

Business intelligence works best when systems stop speaking different languages. Information flows cleanly across tools and platforms, and teams no longer work around mismatched numbers or disconnected reports. A unified data and metrics layer brings information from across the business into a shared analytical foundation. Sales speaks to operations, marketing to finance, and the entire framework resonates in harmony. This fusion removes the invisible friction that slows decisions. When everyone is working from the same definitions and the same underlying data, conversations shift from debating accuracy to discussing direction. It feels like your business always wanted to breathe this way. 

Timing-Aware Business Intelligence

The world is flooded with information but only a few of them can turn it into intelligence. Our approach to business intelligence focuses on delivering environments where your decisions arrive on time and on tone. Our timing-aware business intelligence focuses on delivering insight when it can still influence a decision. We design a system in a way that it recognise when change is meaningful and surface it with the right context rather than urgency. Updates are prioritised based on relevance, so teams are not reacting to constant movement but responding to signals that matter. Think of it like, you won’t be the third person who’s just watching change but will be the one who catches it mid-air.    

Automated Business Intelligence Insights

Modern business analytics should not wait for someone to explore the dashboard. It scans patterns itself and surfaces anomalies, spikes, dips, and correlations the second they appear. In easy words, insights will come to you, not the other way around. This capability shifts BI from a reactive tool into an active participant in decision-making. Instead of relying on scheduled reviews or manual checks, the system stays attentive in the background and watching how data behaves as it updates. If we see in practical, when something important changes, the insight arrives with enough context to be understood. So, you get all the updates on time without putting extra effort or attention.

Governed BI with Metric Lineage

Every decision in a business depends on trust in the numbers behind it. Decision lineage makes that trust visible. We design Business intelligence systems where every metric can be traced end to end. Teams can inspect where a number originated, how it was transformed, which assumptions shaped it, and when it last changed. This transparency removes ambiguity from dashboards and replaces doubt with clarity.

How this changes conversations:

  • Faster agreement
  • Fewer “this number looks wrong” conversations
  • Confidence without confrontation

Context-Aware Metrics

Metrics only drive good decisions when their meaning is clear at the moment they are viewed. And with that goal, we design KPIs, so their definitions live alongside their values, making it immediately clear what is being measured and why it matters. If a metric changes because of certain reasons such as revised formula, updated assumption, or new data source, that shift will be visible into the number. Annotations and contextual notes explain changes like what changed and when. In practice, this means: a metric explains itself. You see how it is defined; you notice when its logic evolves, and you understand the reason behind a movement without digging through documentation or old conversations.

Narrative Intelligence Layer

Charts show movement. Narratives explain meaning. We extend data visualisation with a narrative intelligence layer that automatically translates shifts in data into human language. So, instead of scanning multiple charts to piece together a story, teams receive the reasoning alongside the numbers. Think of an “Explain” button next to every KPI. For example, “Metric X moved because Segment Y slowed after Policy Z changed. Source: Revenue table v4.” By embedding narrative directly into the visual layer, BI becomes easier to interpret and easier to trust. This is BI that answers why before someone has to ask.

Scalable Visual Architecture

At first, dashboards are fast. Then more people start using them. Another team gets access. A few more filters are added. Slowly, performance becomes unpredictable and trust erodes without anyone calling it out. Scalable visual architecture is designed for that reality. Instead of treating visuals as a thin layer on top of data, the visual system is built with intent. High-level views appear first. Detail unfolds only when it is needed. The interface never asks the backend to do unnecessary work just to draw a chart on screen. This matters in environments where insights are consumed on the ground. In retail stores, warehouses, or in factory floors, dashboards often need to run close to the source. Edge-ready visuals make that possible and keep decision-making fast and dependable.

Proof, Not Only Promises 


Explore how 10+ years of experience in the industry build 


The workbench for Business Intelligence (BI) & Data Visualisation

A Decade of BI Practice

In an emerging space like Business Intelligence, experience makes a visible difference. DigiWagon brings over 10 years of hands-on BI expertise, shaped by working through changing data architectures, evolving visualisation standards, and growing expectations from decision-makers.

Experts Across Data Lifecycle

Business intelligence and data visualisation demand people who actually understand how data moves, breaks, scales, and gets questioned in real business environments. DigiWagon brings together a full squad of specialists who are comfortable working across modern data pipelines, cloud warehouses, governed metrics, and visualisation layers. This depth of awareness ensures insights are built on dependable data foundations and remain meaningful as systems and requirements evolve.

Tools That Match Reality

DigiWagon works with modern Business intelligence and data visualisation stacks that align with real enterprise data environments. Tool selection is informed by experience with cloud data warehouses, semantic layers, real-time data pipelines, and scalable visualisation platforms so performance remains stable under production workloads. On top of that, our selection of tools is evaluated for how well it integrates with existing data architectures.

Governance, Built In

In Business intelligence and data visualisation, trust is created through governance that operates quietly in the background. DigiWagon embeds role-based access controls, governed semantic layers, lineage visibility, and metric standardization directly into BI environments. Reporting logic is aligned with data ownership models, audit requirements, and version control practices, allowing dashboards to remain reliable as data sources and users evolve.

Post-Launch Support

Once Business intelligence and data visualisation solutions go live, DigiWagon stays closely involved to ensure they continue performing as intended. Support includes monitoring dashboard accuracy, updating data models when sources change, refining visual logic as business questions evolve, and resolving performance issues tied to growing data volumes.

Why We’re Your Best Bet for Business Intelligence (BI) & Data Visualisation

Digiwagon-header-logo-v1.1
Company A
Company B
⌛ Experience
– – – – – – – – – –
Seasoned pros who’ve seen it all.
Experienced, but often by the book.
Miss the spark for complex projects.
💰 Estimation
– – – – – – – – – –
Honest timelines and budget, zero surprises.
Timelines that shift and swerve often.
Estimates come with ‘oops, missed that!
📄Documentation
– – – – – – – – – – – –
Clear, complete, no missing pieces.
Basic docs, you’ll fill in the gaps.
Sketchy notes, good luck finding info.
🧪 Testing
– – – – – – – –
Glitch-proof before you even see it.
Testing happens once the code is live! 
Testing? Or ‘testing patience?’
☎️ Support
– – – – – – – –
Still by your side, long after the launch.
Support fades after the honeymoon phase.
Support arrives after 10 reminders.

Let’s Make Data Do the Talking

Discover BI that turns every chart into a strategy and every number into an advantage.

Business Intelligence (BI) & Data Visualisation Services - FAQs

Business Intelligence: It is the process of collecting, organizing, and analyzing business data with the intent of helping a company arrive at smarter decisions. It turns complex, refined, and verified data into actionable insights using technology, tools, analytics models, and structured processes.

Data visualisation is the technique of converting data into a form that people can understand at a glance: instead of scrolling through tables, you get visual stories through charts, dashboards, dynamic graphics, and reports that all tell, at a glance, what is happening. In short, it is the bridge between numbers and real understanding.
Business Intelligence is the entire process of collecting data, cleaning, analyzing, and generating insight from it, while Data Visualisation is only a part of this process, where the insight derived is displayed visually in the form of charts, graphs, infographics, and dashboards.

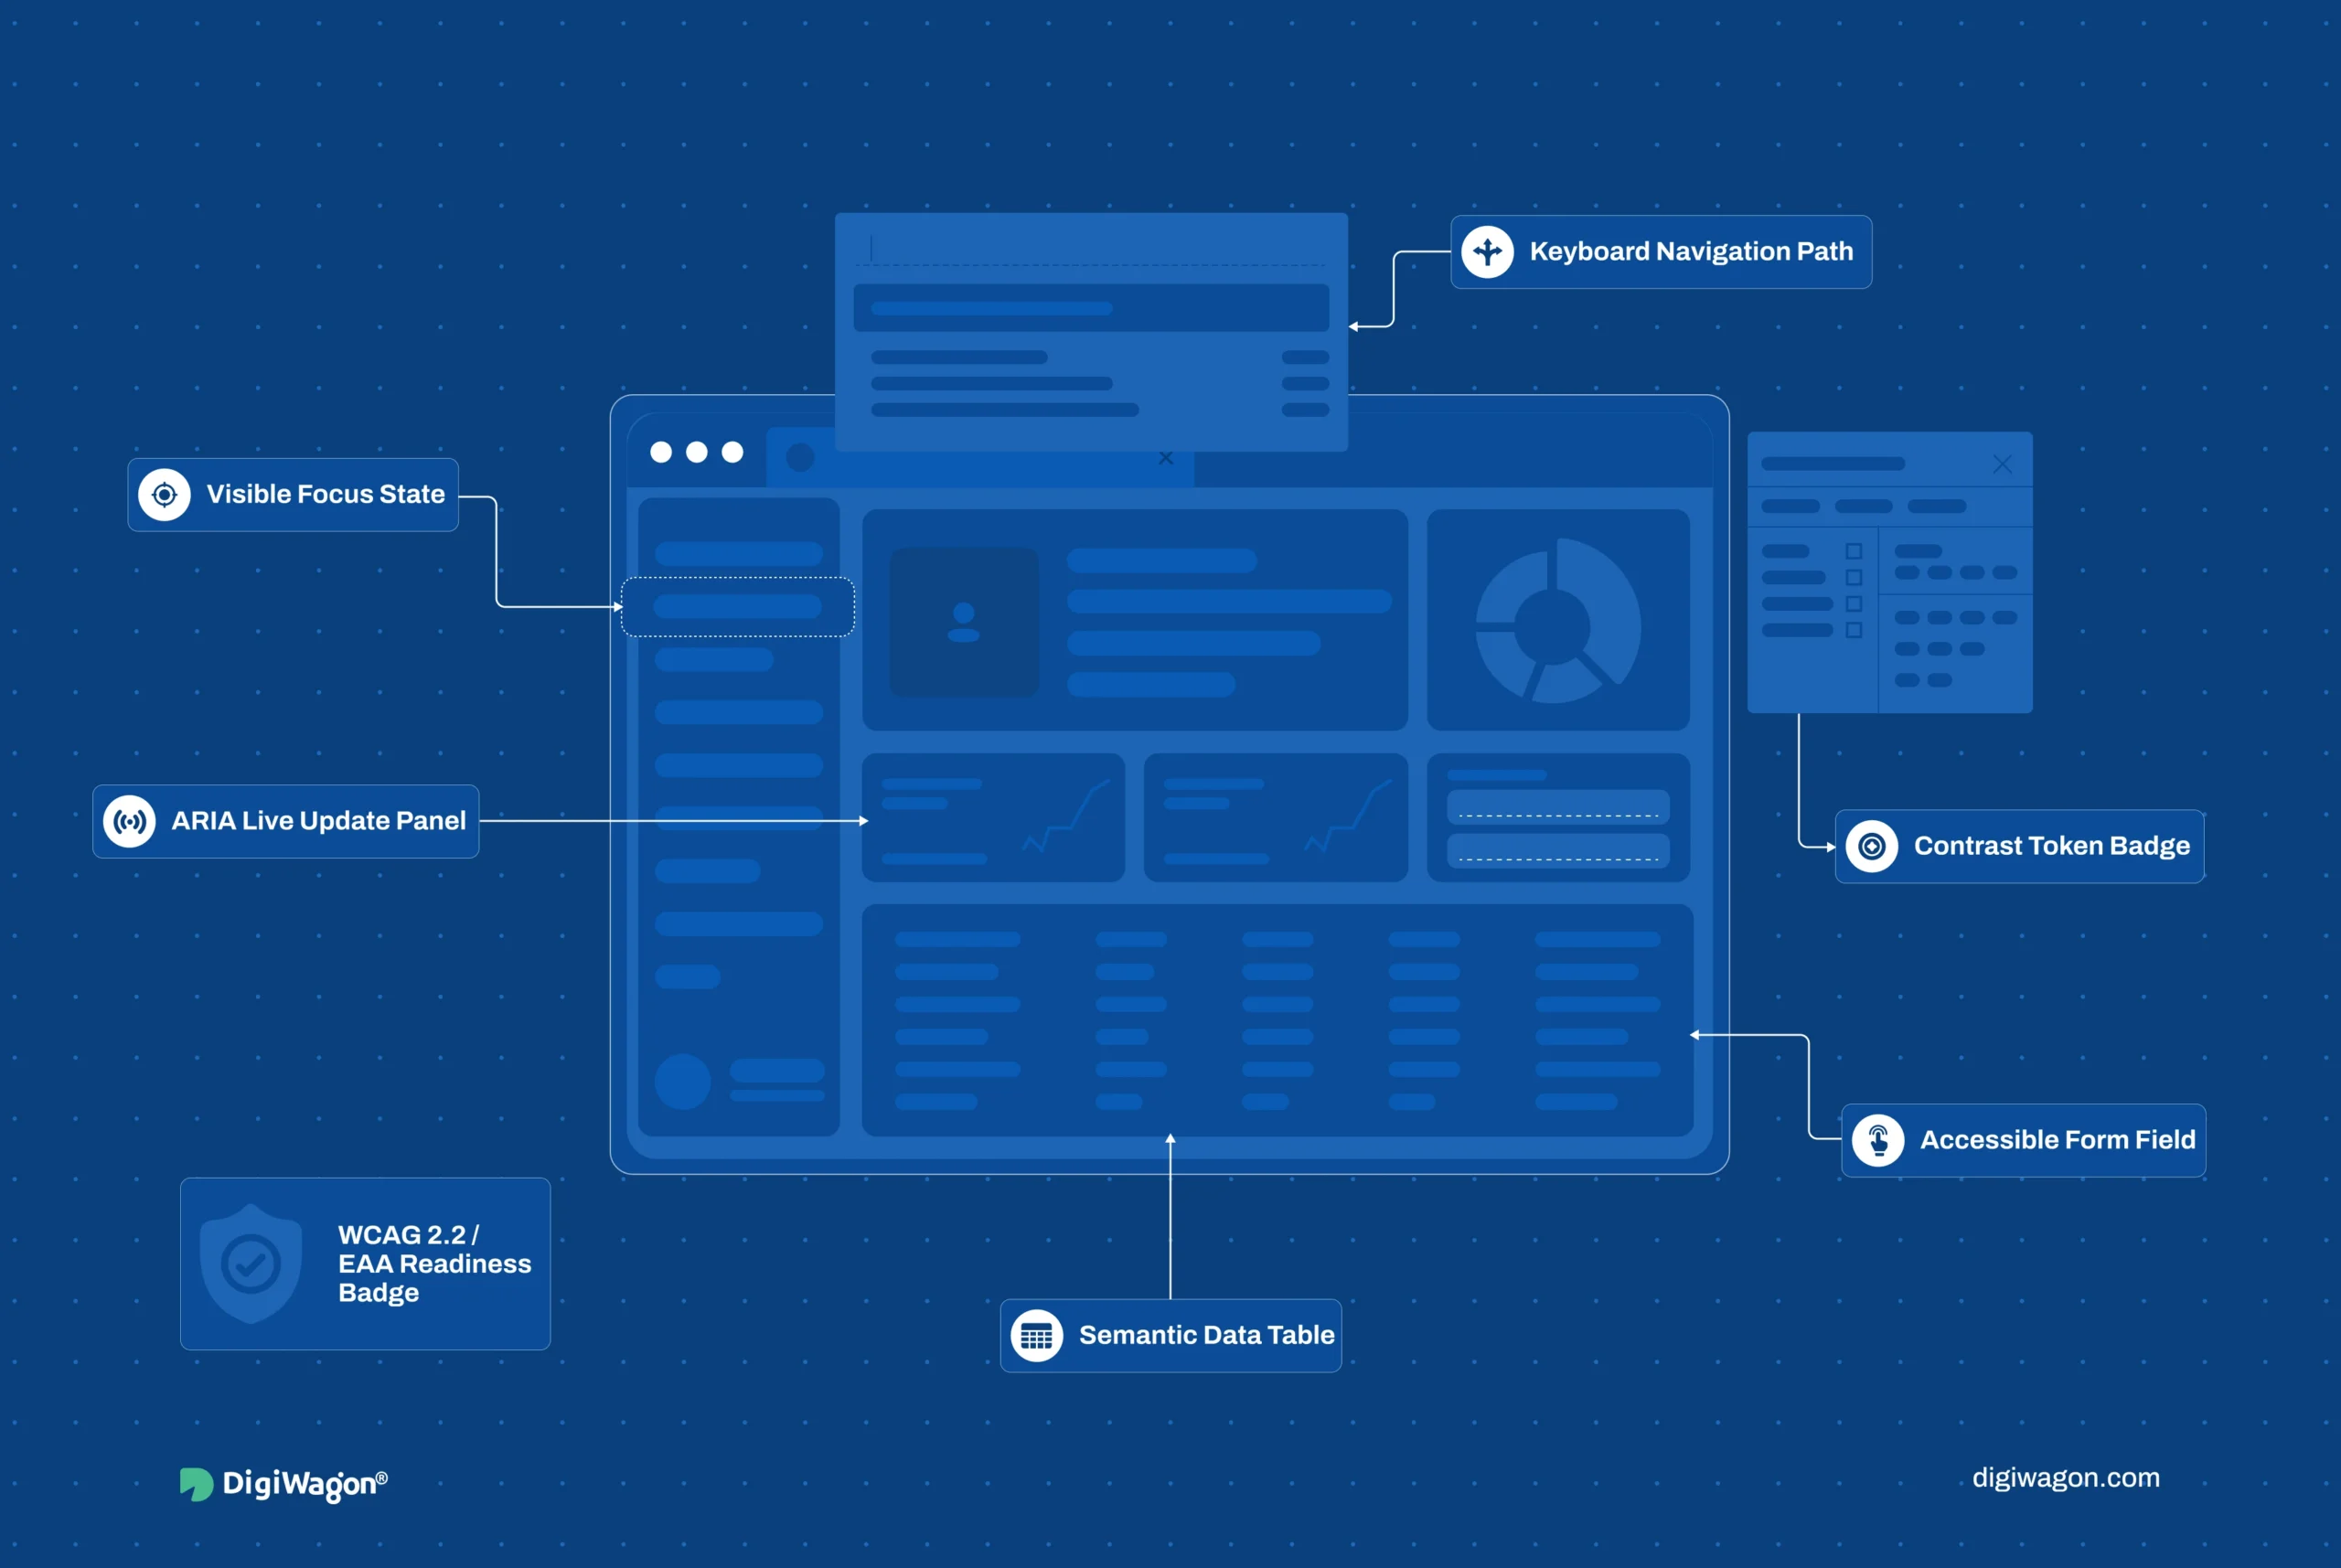
Because they show numbers without enough context to explain what those numbers actually mean. Many dashboards focus on displaying metrics but stop short of explaining how those metrics were calculated, what assumptions sit behind them, or why a change occurred. When definitions vary across teams or updates happen silently, the same dashboard can raise more questions than it answers. This is where DigiWagon approaches BI differently. We design dashboards that carry their context with them including, definitions, lineage, and explanations which live alongside the visuals. So, when something changes, the reason is will be visible.

By using shared metric definitions and a governed data layer that applies the same logic everywhere. In many organisations, numbers drift because teams pull data from different sources or interpret metrics in isolation. Over time, this creates parallel versions of the truth that slow decisions and erode trust. DigiWagon prevents this by designing BI systems around a centralized semantic layer. Metric definitions are created once, governed centrally, and reused consistently across all dashboards and reports. When a definition changes, that change is reflected everywhere at the same time. This ensures sales, marketing, finance, and operations are always looking at the same numbers through the same lens.

No. Well-designed dashboards surface insights on their own instead of relying on constant manual exploration. Traditional dashboards expect users to search for patterns, compare views, investigate changes every time they log in, and figuring out what those movements really mean. That approach works only when time and analytical expertise are always available. For the other side, DigiWgon designs BI systems that observe data continuously and bring attention to changes that matter. Instead of waiting for someone to notice a deviation, the dashboard highlights it and explains why it is relevant. This keeps insights timely without demanding constant manual involvement.

Choosing a BI partner is like trusting someone with the nerve system of your business. Then why we are your right partner? Here’s the answer:


  • 10+ years of hands-on experience working across different industries and data challenges.
  • Use of advanced technology
  • Team of experts who understand the full data lifecycle
  • A proven portfolio of BI projects


And there are still more checks that we pass, but the bottom line is simple: you’re in safe, savvy hands.

Related Services

Case Studies​

Cover image showing accessibility-first UX built into design system primitives, focus management, ARIA live regions, keyboard flows, semantic dashboards, WCAG 2.2, and EAA readiness.
15 June 2026
Accessibility-First UX: A Field-Tested Playbook
12 June 2026
Production-Grade Design Systems: An Architecture
Cover image showing a compliance analyst workflow decision desk with alert review, reason codes, matched fields, case timeline, four-eyes approval, false-positive feedback, and regulator export.
10 June 2026
The Compliance Analyst Workflow Playbook
Download Whitepaper

Fill in your details to access the whitepaper

This field is for validation purposes and should be left unchanged.
Download Whitepaper

Fill in your details to access the whitepaper

This field is for validation purposes and should be left unchanged.
Download Whitepaper

Fill in your details to access the whitepaper

This field is for validation purposes and should be left unchanged.