
Transaction Monitoring Architecture: What Actually Matters
- Transaction monitoring is a streaming detection problem, not a rules checklist; the architecture decides whether the system adapts to new typologies or ossifies.
- A configurable rules engine plus a behavioural profiling layer outperforms rules alone, because static rule structures cannot track evolving laundering patterns.
- Real-time and batch monitoring must share one stateless evaluator core, or the two paths drift and produce inconsistent decisions on the same transaction.
- Scenario calibration tooling built into the platform is what makes false-positive reduction iterative rather than a one-time threshold guess.
- Writing decision provenance into every alert record at creation time is the only design that survives a deterministic regulator reconstruction.
Transaction monitoring architecture is the streaming detection system that evaluates transactions against rules and behavioural models in real time, raises alerts with deterministic provenance, and reconciles against a batch path so the same transaction yields the same decision in both modes. The architecture, not the rule count, determines whether the system adapts to new laundering typologies.
Why Rules Alone Stop Working
The first version of almost every transaction monitoring system is a rules engine: thresholds on amount, velocity, geography, counterparty risk. It works until laundering typologies evolve, which they do continuously.
The Wolfsberg Group’s transaction monitoring guidance frames monitoring effectiveness as a function of scenario design and behavioural context, not the number of rules running. A system with hundreds of static rules generates more alerts, most of them false positives, while still missing patterns that no single rule describes. The architectural problem is that a static rule encodes a known typology; it cannot detect a structuring pattern it was never written for.
The stack that adapts pairs a configurable rules engine with a behavioural profiling layer. Rules catch the known typologies cheaply; behavioural models flag deviations from an entity’s established pattern, which is where novel typologies first show up. This sits downstream of the AML watchlist data pipeline architecture and alongside the AML screening engine architecture; monitoring watches behaviour over time, where screening matches identities at a point in time.
What Are the Core Layers of a Transaction Monitoring Stack?
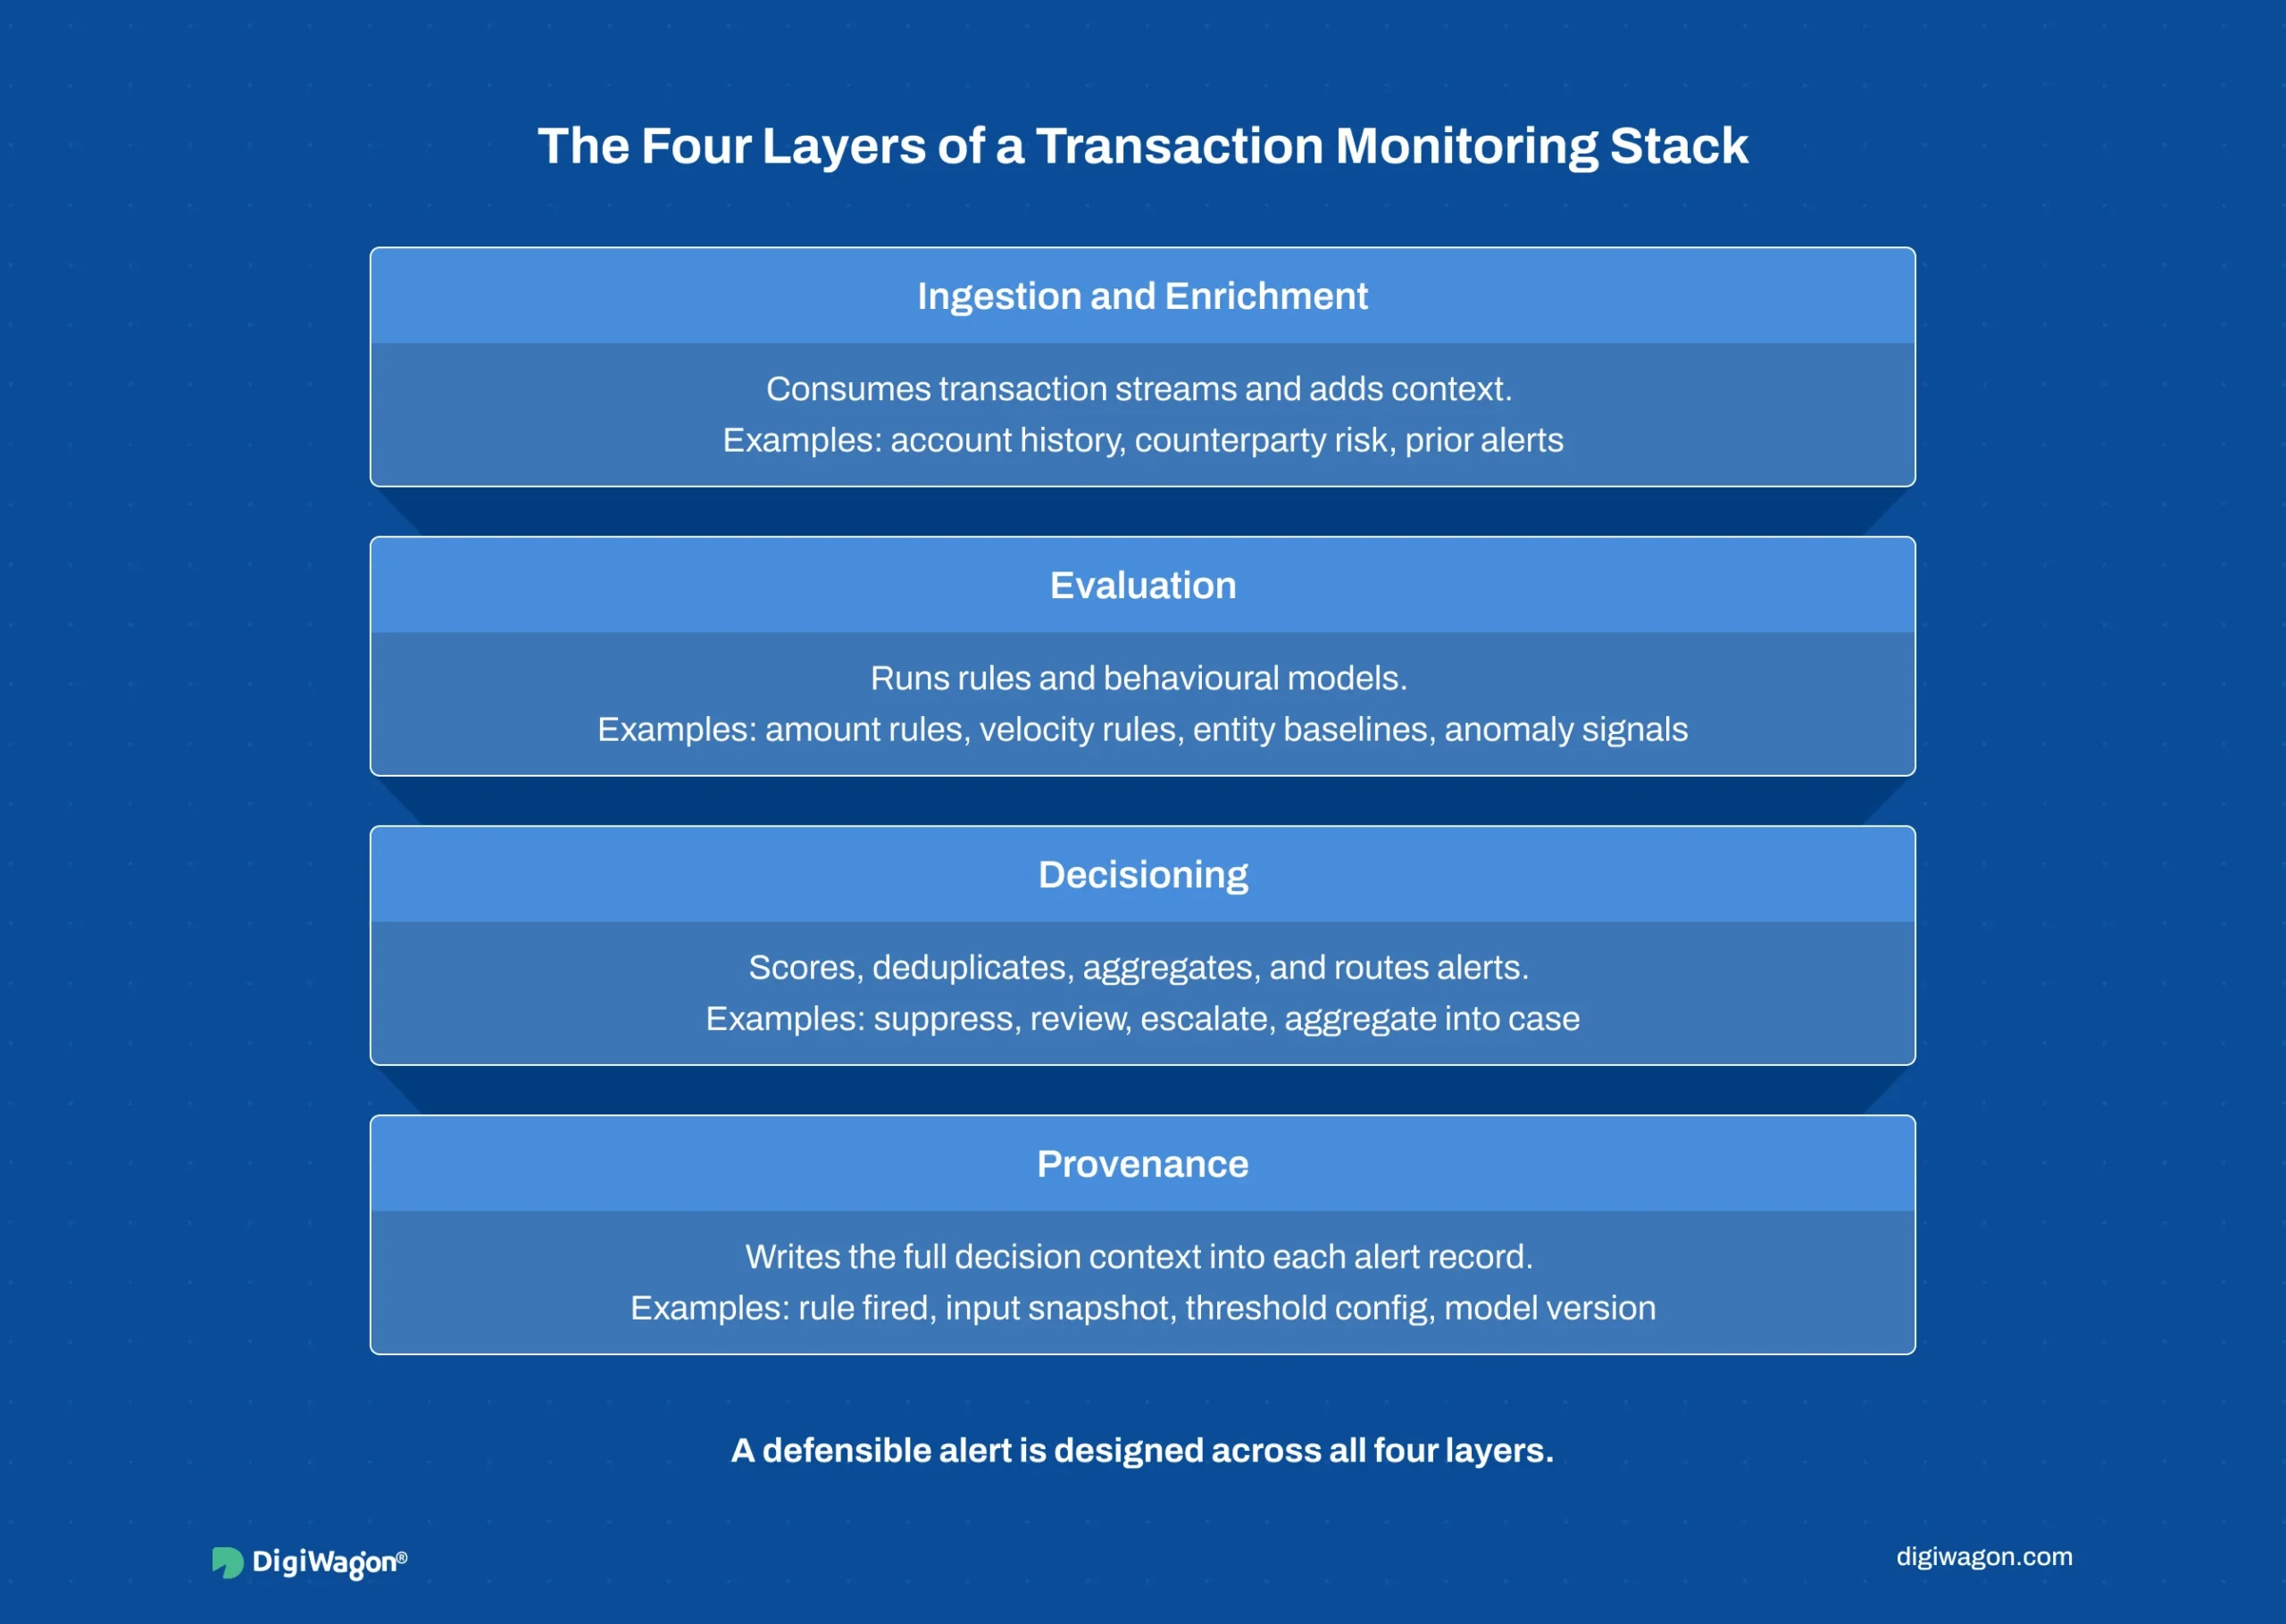
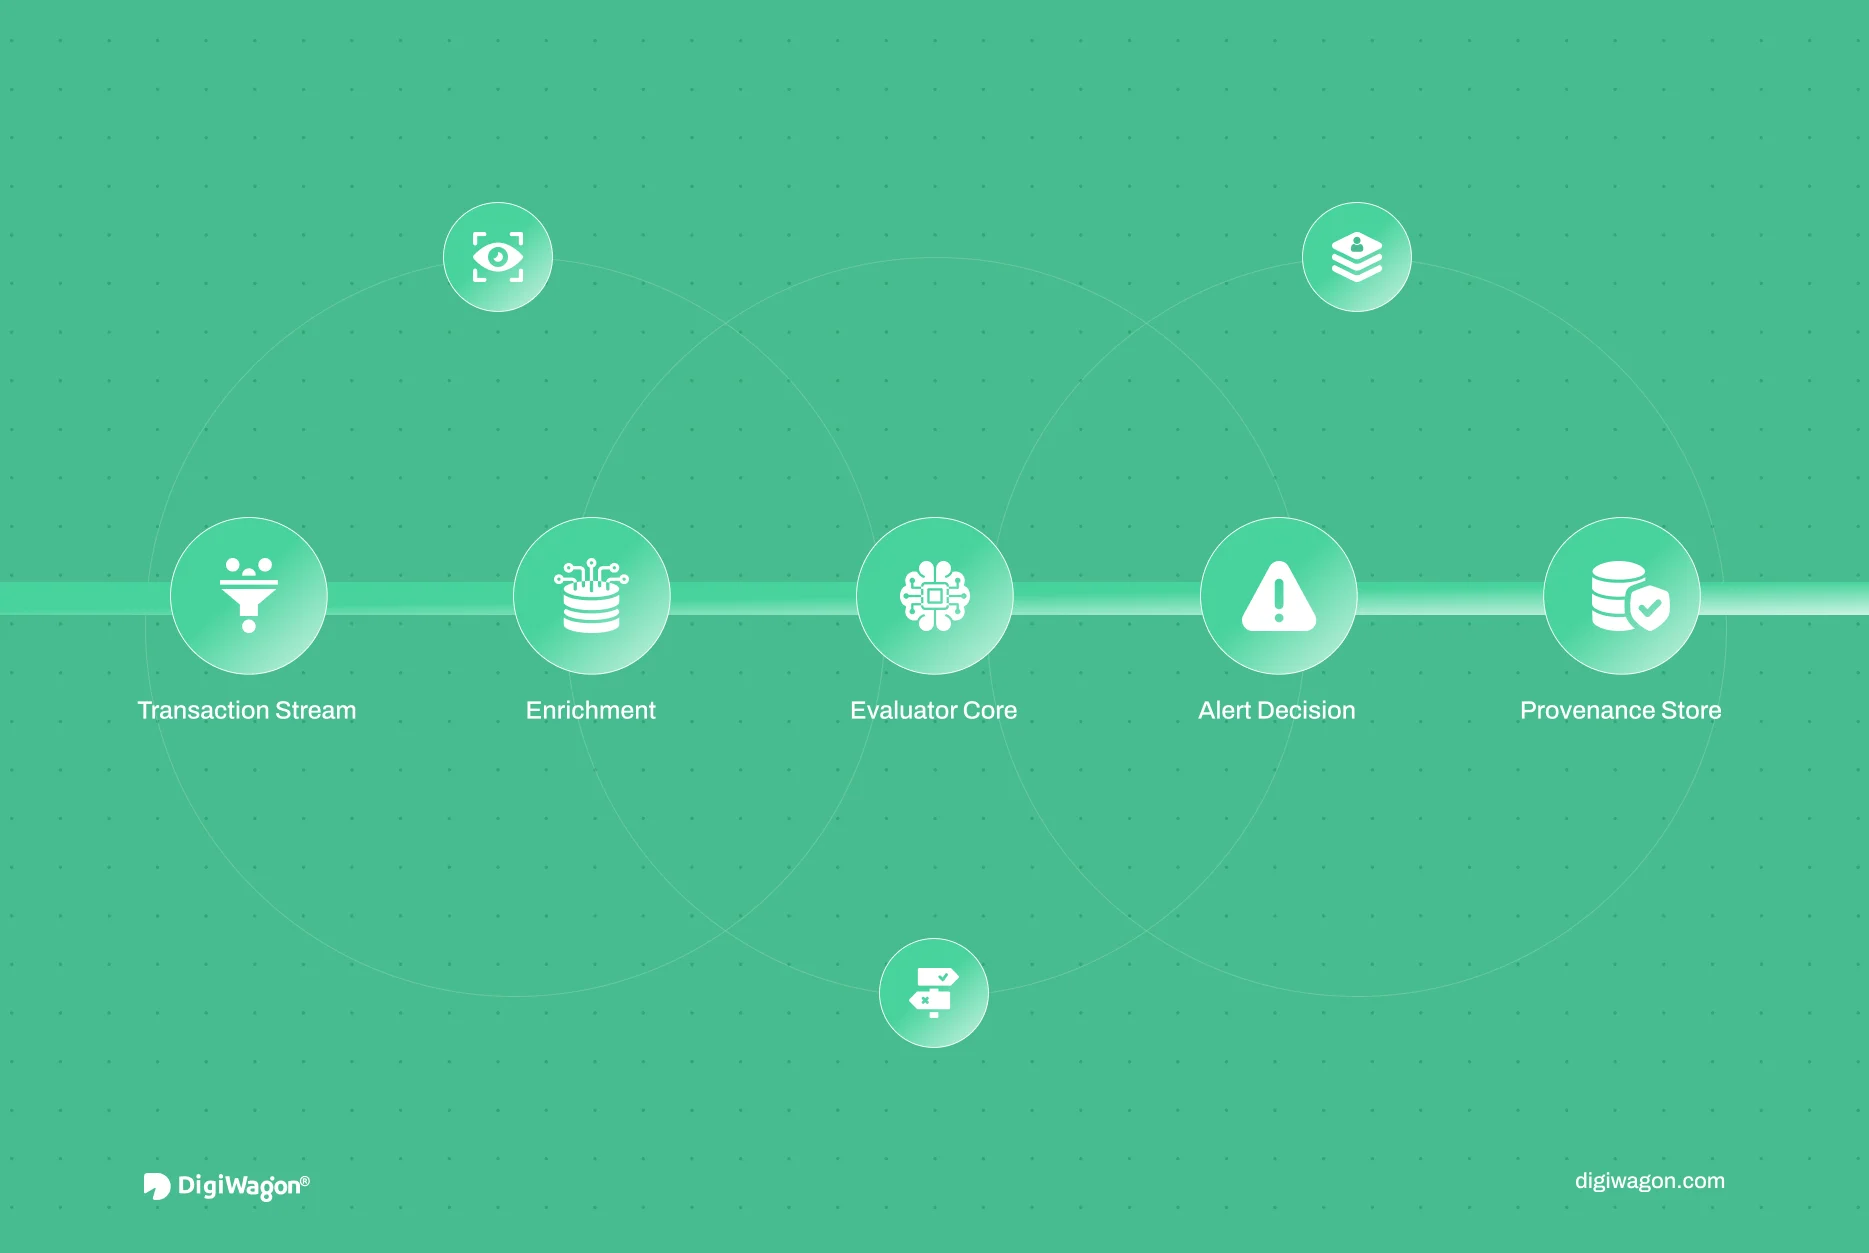
A production monitoring stack has four layers, each a distinct engineering concern.
The ingestion layer consumes the transaction stream and enriches each event with the context monitoring needs: account history, counterparty risk, prior alert state. Enrichment at ingestion is what lets downstream evaluation run without per-rule database lookups.
The evaluation layer runs the configurable rules engine and the behavioural profiling models against each enriched event. This is the detection core.
The decisioning layer scores, deduplicates, and routes alerts: auto-escalate, queue for analyst review, or suppress. It also handles alert aggregation so a structuring pattern across many transactions surfaces as one case, not fifty alerts.
The provenance layer writes the full decision context into every alert record at the moment of creation: which rule or model fired, the input snapshot, the threshold configuration active, and the model version. This is the layer regulators reconstruct against.
The behavioural models in the evaluation layer are detection-engineering work owned by the AI and ML engineering practice; the four-layer stack is the architecture they run inside.
How Do Real-Time and Batch Monitoring Stay Consistent?
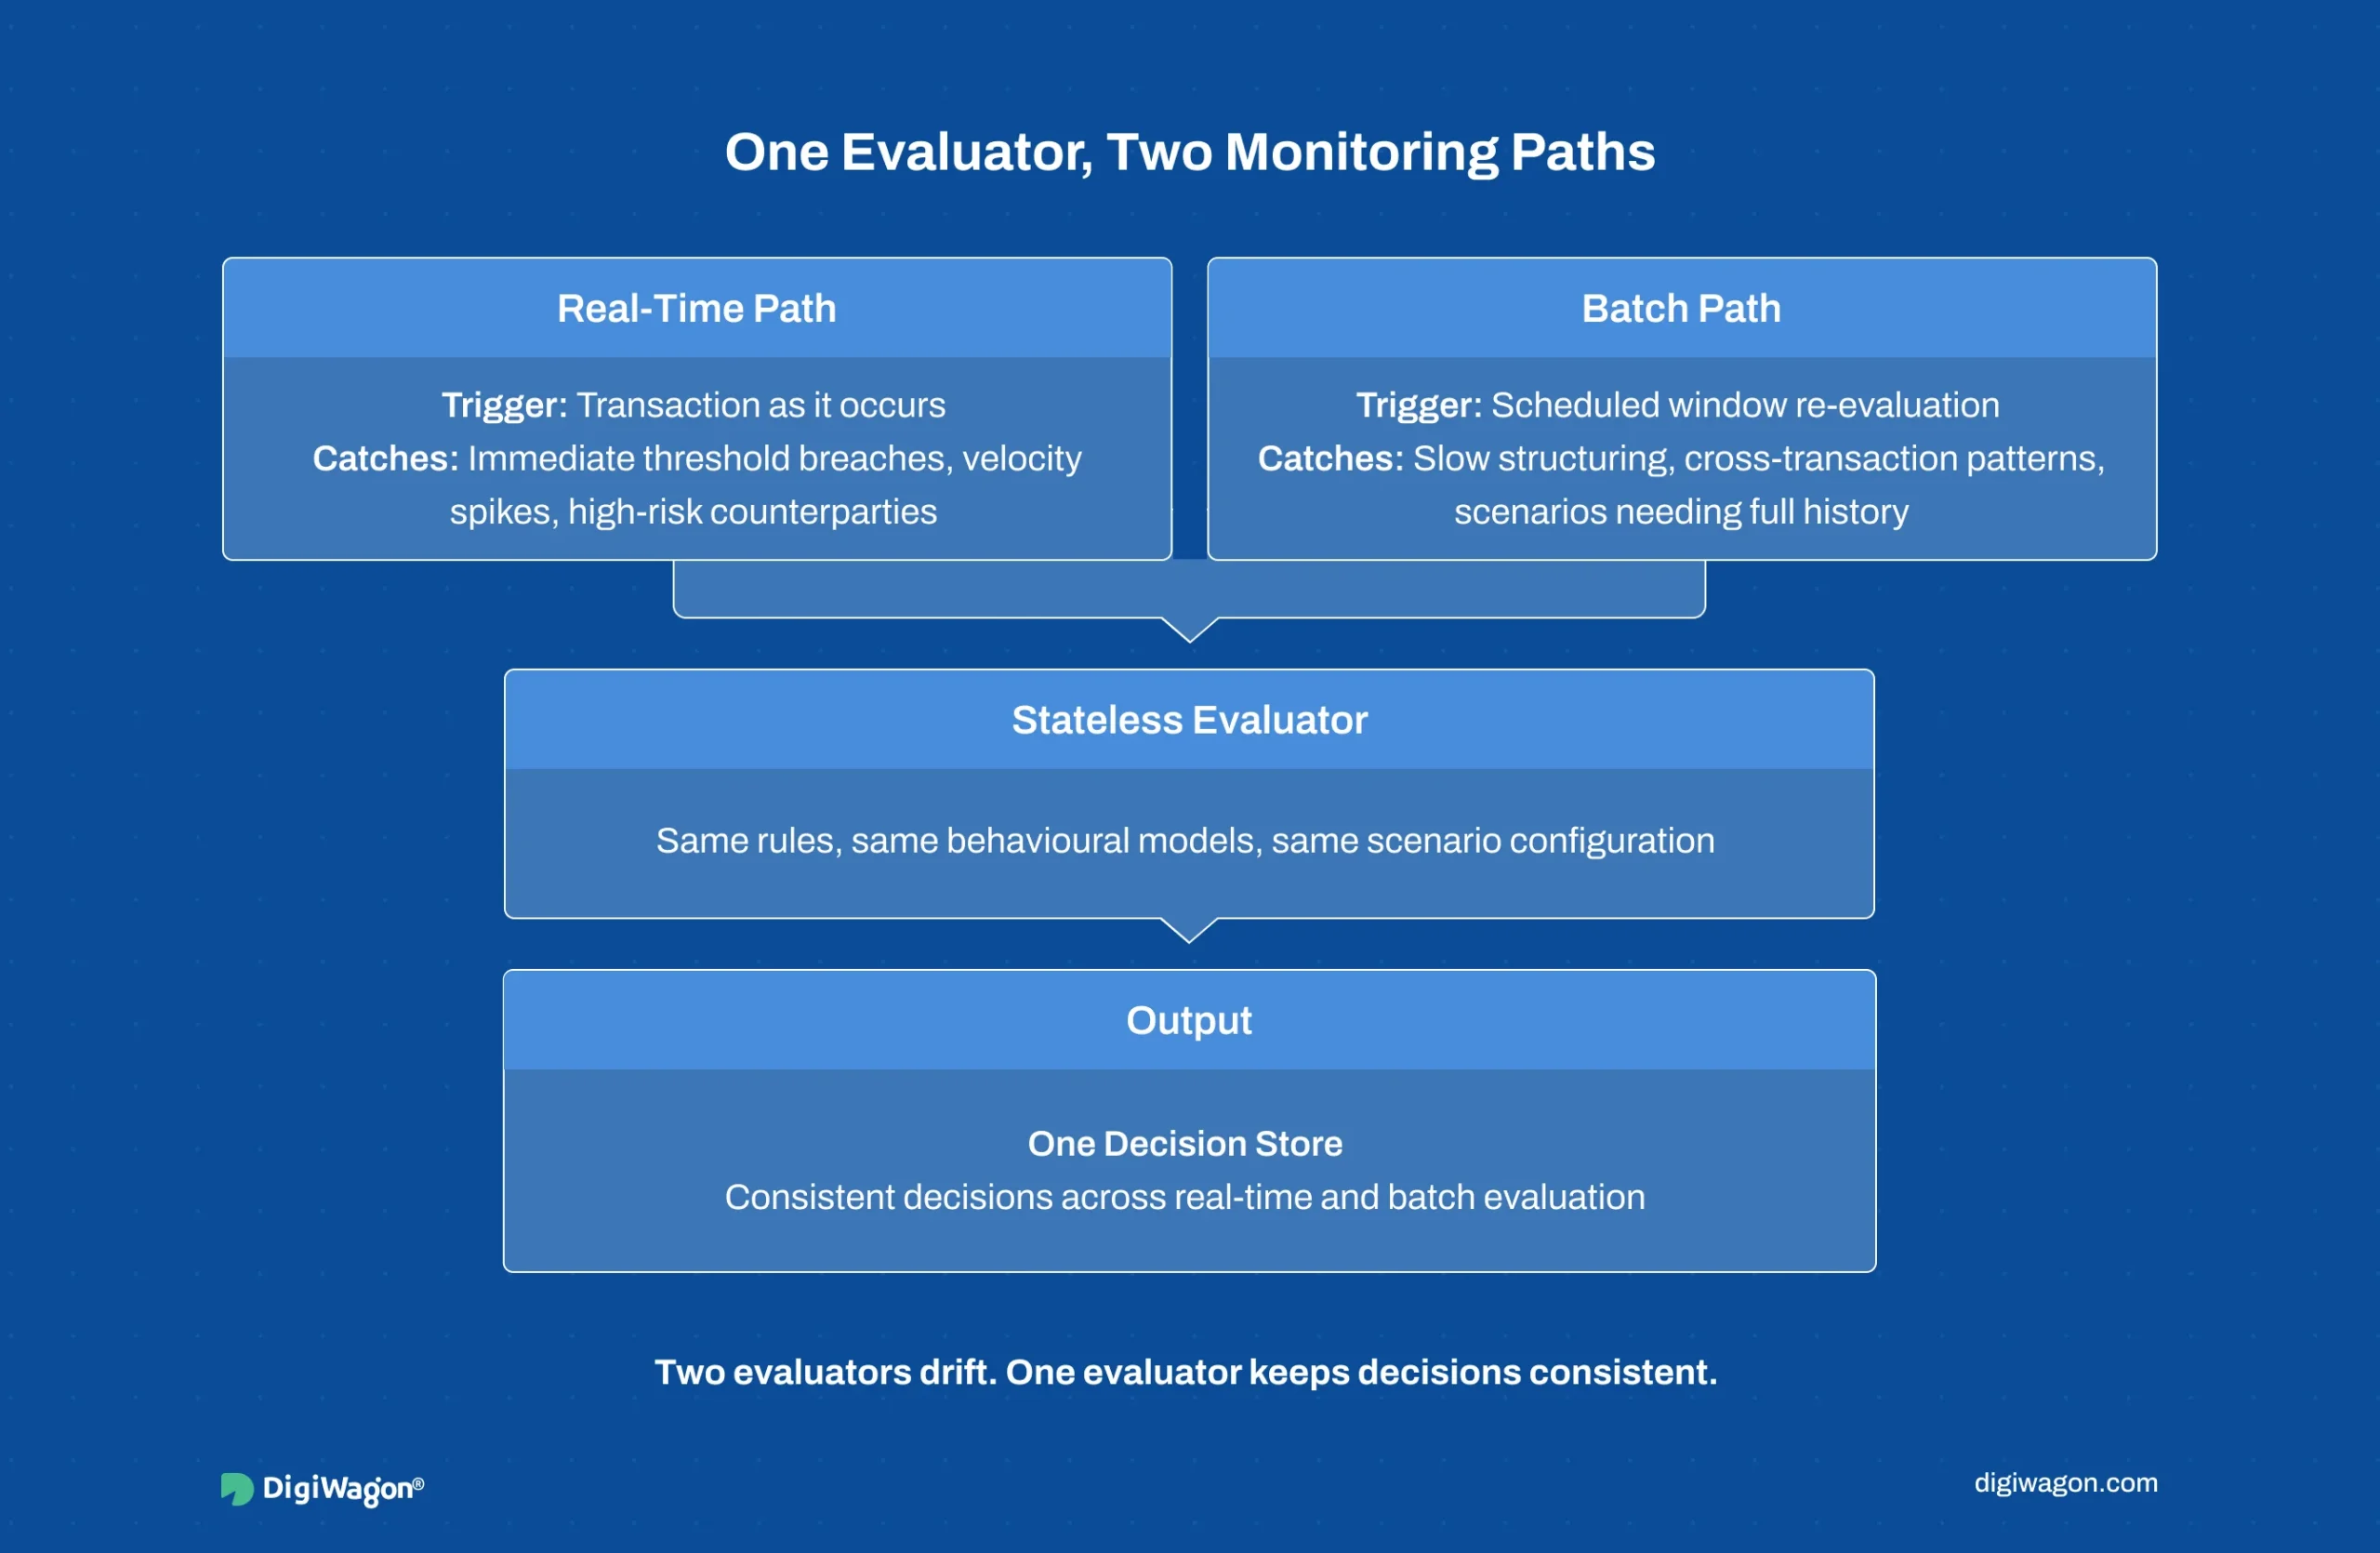
Transaction monitoring runs in two modes. Real-time evaluation gates or flags transactions as they occur. Batch evaluation re-runs scenarios across a window of historical transactions, catching patterns that only emerge over time, such as slow structuring across weeks.
The architectural trap is maintaining two evaluation implementations, one tuned for streaming and one for batch. They drift. A real-time alert and a batch re-evaluation then produce different decisions on the same transaction, which surfaces as a regulator finding when the inconsistency is discovered.
The pattern that holds is a single stateless evaluator core fronted by two ingress paths. The real-time path streams enriched events into the evaluator synchronously. The batch path fans historical events through the same evaluator in parallel. Both write to one decision store. Because the evaluator is stateless and shared, the same input plus the same scenario configuration produces the same decision regardless of which path invoked it.
| Path | Trigger | Catches | Shares |
|---|---|---|---|
| Real-time | Transaction as it occurs | Immediate threshold breaches, velocity spikes, sanctioned counterparties | The stateless evaluator core |
| Batch | Scheduled window re-evaluation | Slow structuring, cross-transaction patterns, scenarios needing full history | The stateless evaluator core |
This is the dual-ingress, shared-evaluator pattern the RegTech integration architecture blueprint describes generically; transaction monitoring is the surface where it is most stressed, because the cost of drift is a regulator-visible inconsistency.
How Do You Reduce False Positives Without Missing Real Activity?

False positives are the chronic failure of transaction monitoring. Too many, and analysts drown and miss real cases; too few, and the system misses laundering. The balance is set by scenario thresholds, and the architectural question is whether thresholds are tuned once or iterated continuously.
Static threshold tuning sets values at deployment and revisits them rarely. It fails because the right thresholds depend on the specific client’s transaction profile, which is not known until production data accumulates. The architecture that works embeds scenario calibration tooling in the platform: the ability to test a threshold change against historical production data, see the projected alert volume and the cases it would have caught or missed, and deploy the calibrated scenario without a code release.
The Bank for International Settlements has documented how instant and real-time payment systems compress the window for monitoring decisions, which raises the cost of poorly calibrated scenarios: a false positive that delays an instant payment is a worse customer outcome than one that delays a batch settlement. Calibration tooling is what keeps the false-positive rate manageable as transaction volume and payment speed grow.
Lessons from Building a Transaction Intelligence Platform
DigiWagon built the Transaction Intelligence and Behavioral Analytics platform for an AML compliance vendor, covering real-time monitoring, behavioural profiling, and analyst case management. Four architectural decisions defined the stack.
First, a configurable rules engine paired with a behavioural profiling layer, chosen over rules-only because static rule structures could not adapt to evolving typologies; the profiling layer flagged deviations from established entity behaviour that no single rule described. Second, a real-time path and a batch reconciliation path sharing a stateless evaluator core, so the two modes could not drift into inconsistent decisions on the same transaction. Third, scenario calibration tooling embedded in the platform over static threshold tuning, because false-positive reduction required iterating on production data, not guessing thresholds at deployment. Fourth, decision provenance written into every alert record at creation over log-derived lineage, because regulator reconstruction has to be deterministic, not reassembled forensically.
At the stack level, the streaming path was built on a partitioned event-streaming framework (Kafka-style log semantics) over a queue-based system, because ordered, replayable, partitioned event logs let the batch path replay the exact event sequence the real-time path saw. Replayability was the deciding factor: a queue that drops ordering cannot reproduce a real-time decision for the batch reconciliation to check against.
DigiWagon’s Role in Transaction Monitoring Engineering
DigiWagon engineers transaction monitoring stacks as production systems: streaming ingestion, configurable rules and behavioural models, dual-path evaluation, and deterministic alert provenance. The work draws on the RegTech software development practice.
- Streaming ingestion and event enrichment architecture
- Configurable rules engine plus behavioural profiling layer design
- Dual real-time and batch paths over a shared stateless evaluator
- Scenario calibration tooling and deterministic alert provenance
Engineering Monitoring Stacks That Adapt
A transaction monitoring stack is judged by whether it adapts as laundering typologies change and whether its real-time and batch decisions agree. The architecture that delivers both is a configurable rules engine paired with behavioural profiling, a single stateless evaluator serving real-time and batch paths, calibration tooling that makes threshold tuning iterative, and provenance written at alert creation. Each is decided at design time, because retrofitting behavioural profiling onto a rules-only engine, or reconciling two evaluators that have already drifted, is a rebuild. Stacks built to the pattern keep pace with the typologies they were never originally written for.
Planning a Transaction Monitoring Stack?
Our data engineering team works through streaming architecture, scenario design, and alert provenance with your compliance and engineering teams in one room.