Grafana Consulting Services for Observability That Answers
See It Before They Do.
A dashboard is not observability. Observability is being able to ask a new question of a running system and get an answer — which service, which tenant, which deploy, which query — before a customer asks it for you. Grafana, with Prometheus, Loki and Tempo behind it, is the open-source stack that makes that possible without a per-gigabyte ransom.
Our Grafana consulting services cover the observability architecture, instrumentation with OpenTelemetry, dashboards people actually read, alerting on service-level objectives rather than on CPU, and the operations that keep the stack itself healthy.
From OpenTelemetry instrumentation to alerts that page on user impact, our Grafana consulting services turn metrics, logs and traces into answers.
01
Observability Architecture
Prometheus or Mimir for metrics, Loki for logs, Tempo for traces, Grafana in front — self-hosted or Grafana Cloud — sized for your cardinality and retention, with the data model, labels and tenancy designed before the first dashboard so the stack answers questions instead of collecting noise.
Prometheus, Mimir, Loki and TempoSelf-hosted or Grafana CloudLabel and cardinality designRetention and tenancy
Services instrumented with OpenTelemetry for metrics, logs and traces that correlate — a trace ID in every log line, business metrics next to technical ones, exemplars linking a latency spike to the exact request — so a dashboard click leads to the cause, not to another dashboard.
OpenTelemetry SDKs and collectorsCorrelated logs, metrics and tracesBusiness metrics alongside technicalExemplars and drill-down
Service, team and executive dashboards designed around the questions each audience asks — golden signals, service-level indicators, tenant and revenue views — provisioned as code, versioned and reviewed, with the fifteen-panel graveyards retired.
Audience-designed dashboardsGolden signals and SLIsDashboards as codeBusiness and tenant views
Service-level objectives agreed with the business, error budgets and burn-rate alerts that page on user impact rather than on a CPU threshold, routing to the people who can act, and runbooks linked from the alert — fewer pages, each of them real.
SLOs and error budgetsBurn-rate alertingRouting and escalationRunbooks linked from alerts
The observability stack run as a product: upgrades, capacity and retention management, cardinality control, cost per signal reviewed monthly, and the migration from proprietary observability vendors whose bills grew faster than the systems they watched.
Upgrades and capacity managementCardinality and cost controlVendor migrationMonthly cost-per-signal review
What changes when the team actually knows the stack, in six rows.
Feature
DigiWagon
Other agencies
Architecture
Landing zones, network boundaries and account structure designed before the first workload, not discovered after the first incident.
A console click-through that nobody can reproduce.
Security & compliance
Least-privilege identity, encryption by default, audit trails and evidence mapped to ISO/IEC 27001 controls from day one.
Security as a checklist, after the audit finding.
Cost
Right-sized from the start: tagging, budgets, alerts and the reserved-vs-on-demand call made with numbers.
The bill is a surprise every month.
Estimation
Real timelines and budget, with the assumptions written down — no plot twist.
Estimate comes with ‘oops, missed that!’
Reliability
Infrastructure as code, tested rollbacks, backups that were actually restored, runbooks your team can follow at 3 a.m.
Snowflake servers and a prayer.
Documentation
Diagrams, decision records and runbooks that survive the engineer who wrote them.
The knowledge left with the contractor.
Industries
Where Our Grafana Work Lives
Three of the nine industries we build for, with the Grafana fit behind each, linked to the industry page.
01
Manufacturing
Plant telemetry, line throughput and equipment health from sensors and PLCs into Prometheus and Grafana — operational dashboards on the shop floor and alerts that reach the shift supervisor before the line stops.
Transaction latency, screening throughput and error budgets by service and tenant, with the audit-friendly retention and access control a regulated platform’s observability data itself needs.
Fleet, warehouse and integration telemetry correlated across services, so a delayed shipment is traced to the failing partner API rather than debated across three teams.
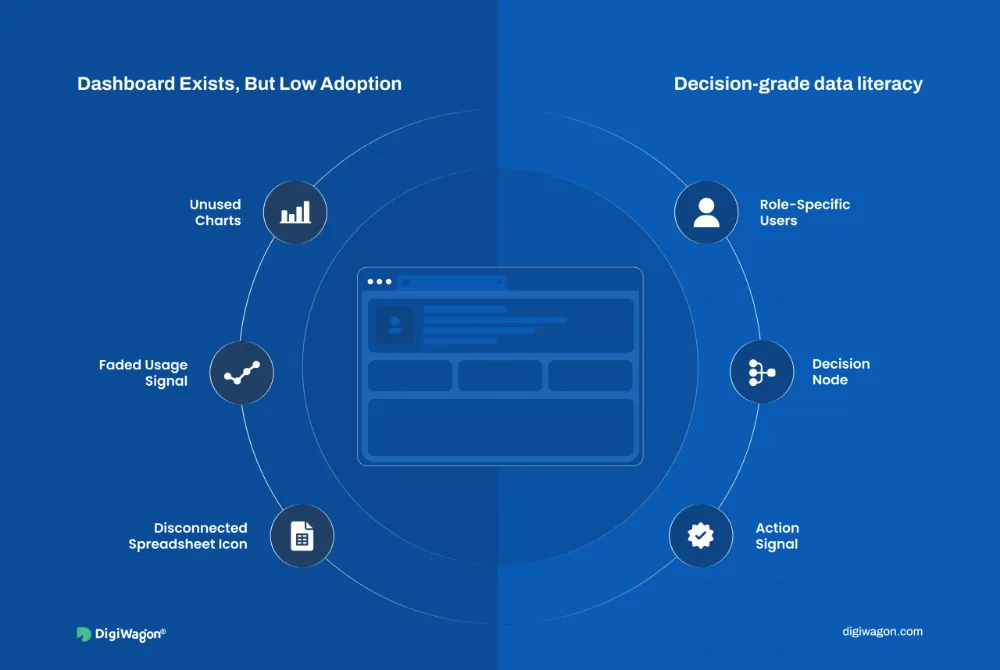
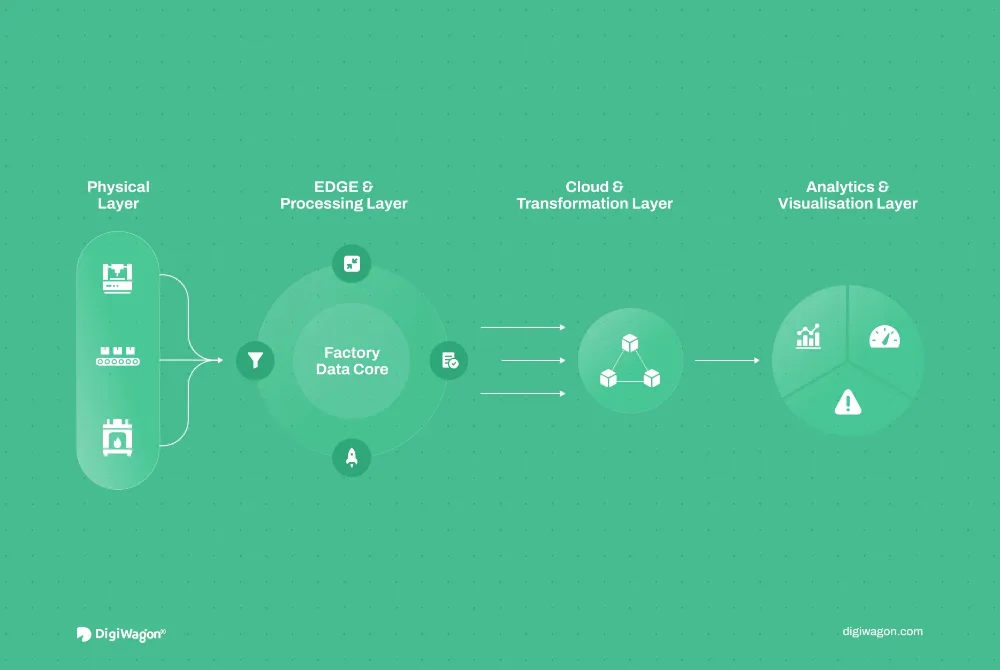
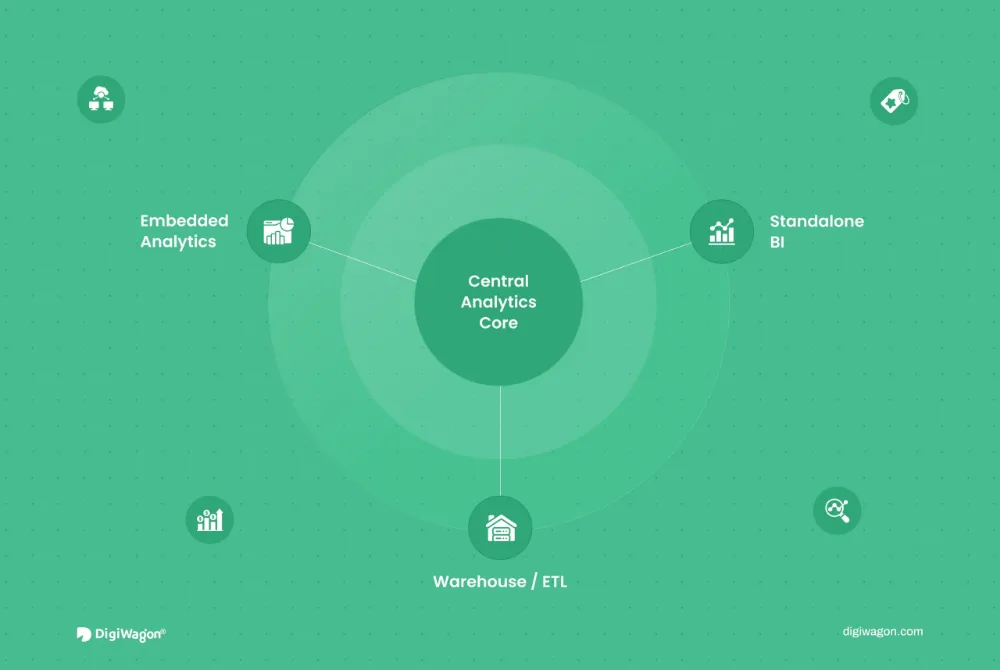
Writing from the data and platform work: why BI dashboards fail, a proven real-time data pipeline from sensor ingestion to operational dashboards, and embedded analytics versus standalone BI.
Data & Analytics
Why BI Dashboards Fail: Enterprise Data Literacy Playbook
· Kartik Gajjar · 7 min read
Data & Analytics
Proven Real-Time Data Pipeline for Manufacturing: From Sensor Ingestion to Operational Dashboards
· Akash Thakor · 9 min read
Data & Analytics
Embedded Analytics vs. Standalone BI: Which Reporting Architecture Fits Your SaaS Product?
Direct answers on Grafana versus commercial observability, self-hosted versus Grafana Cloud, instrumentation, alerting, cost and what our Grafana consulting services include after the stack is live.
01Grafana or a commercial observability platform?
Grafana with Prometheus, Loki and Tempo gives the same three signals without per-gigabyte or per-host pricing, and it is open source, so the data and the dashboards are yours. Commercial platforms offer more out of the box and less to run. Many teams migrate to Grafana when the vendor bill outgrows the infrastructure bill; we help decide and migrate.
02Self-hosted Grafana stack or Grafana Cloud?
Self-hosted when you have a platform team, a compliance reason to keep telemetry inside your boundary or a scale where it is clearly cheaper. Grafana Cloud when you would rather pay for the stack to be someone else’s problem and your volumes fit its pricing. We size both from your actual signal volume before recommending.
03What is the difference between monitoring and observability?
Monitoring answers questions you thought of in advance — is the CPU high, is the site up. Observability lets you ask questions you did not anticipate — why is this tenant slow since the last deploy — by correlating metrics, logs and traces with enough context. Dashboards are a start; instrumentation and data design are what make the difference.
04How do you stop alert fatigue?
By alerting on user impact rather than on resource thresholds: service-level objectives agreed with the business, error budgets and burn-rate alerts that page only when the objective is genuinely at risk, everything else as a ticket or a dashboard. Fewer pages, each real, each linked to a runbook — on-call becomes survivable.
05How do you control observability costs?
Cardinality is the cost driver for metrics and volume for logs, so we design labels deliberately, drop what nobody queries, set retention per signal, sample traces intelligently and review cost per signal monthly. Teams migrating from proprietary vendors typically cut the observability bill substantially while keeping the same visibility.
06What does support look like after the stack is live?
Upgrades of Grafana and the backends on a schedule, capacity and retention management, cardinality reviews, dashboard and alert evolution as the product changes, and a quarterly review of what the on-call team actually used. Dashboards, alert rules and infrastructure are code in your repositories; we run the stack for you, with you, or hand it over.
Know Before the Customer Does.
Tell us what you cannot currently see when something goes wrong, and we will show you comparable observability work before anything is scoped.
One click opens the assistant you already use with a question that points it at this page, so the answer comes from what we publish, not a guess.
The question it opens withRead https://digiwagon.com/grafana and explain when DigiWagon recommends Grafana, what it would ask about my product before scoping, and which of its case studies are relevant. Stick to what the page says and mark anything you are not sure about.